Key takeaways:
Website analytics are a critical part of building any successful website, regardless of your industry
Analytics range from metrics as basic page views to tracking entire customer journeys
Combining quantitative data with qualitative insights is how to understand the what and the why behind behavior
Web analytics can work through a simple code snippet put on your website
The best way to analyze your website is through using an analytics tool
When selecting an analytics tool, make sure its features align with your business goals
What are web analytics?
Operating and maintaining a website is no easy task. As a business, it’s important to know how well your website is performing and understand your users’ behavior. Web analytics can help you do just that by tracking user data on your site, such as:
Page views
Number of visits
Time on page
Bounce rate
Referral sources
Conversions
Purchases
Retention
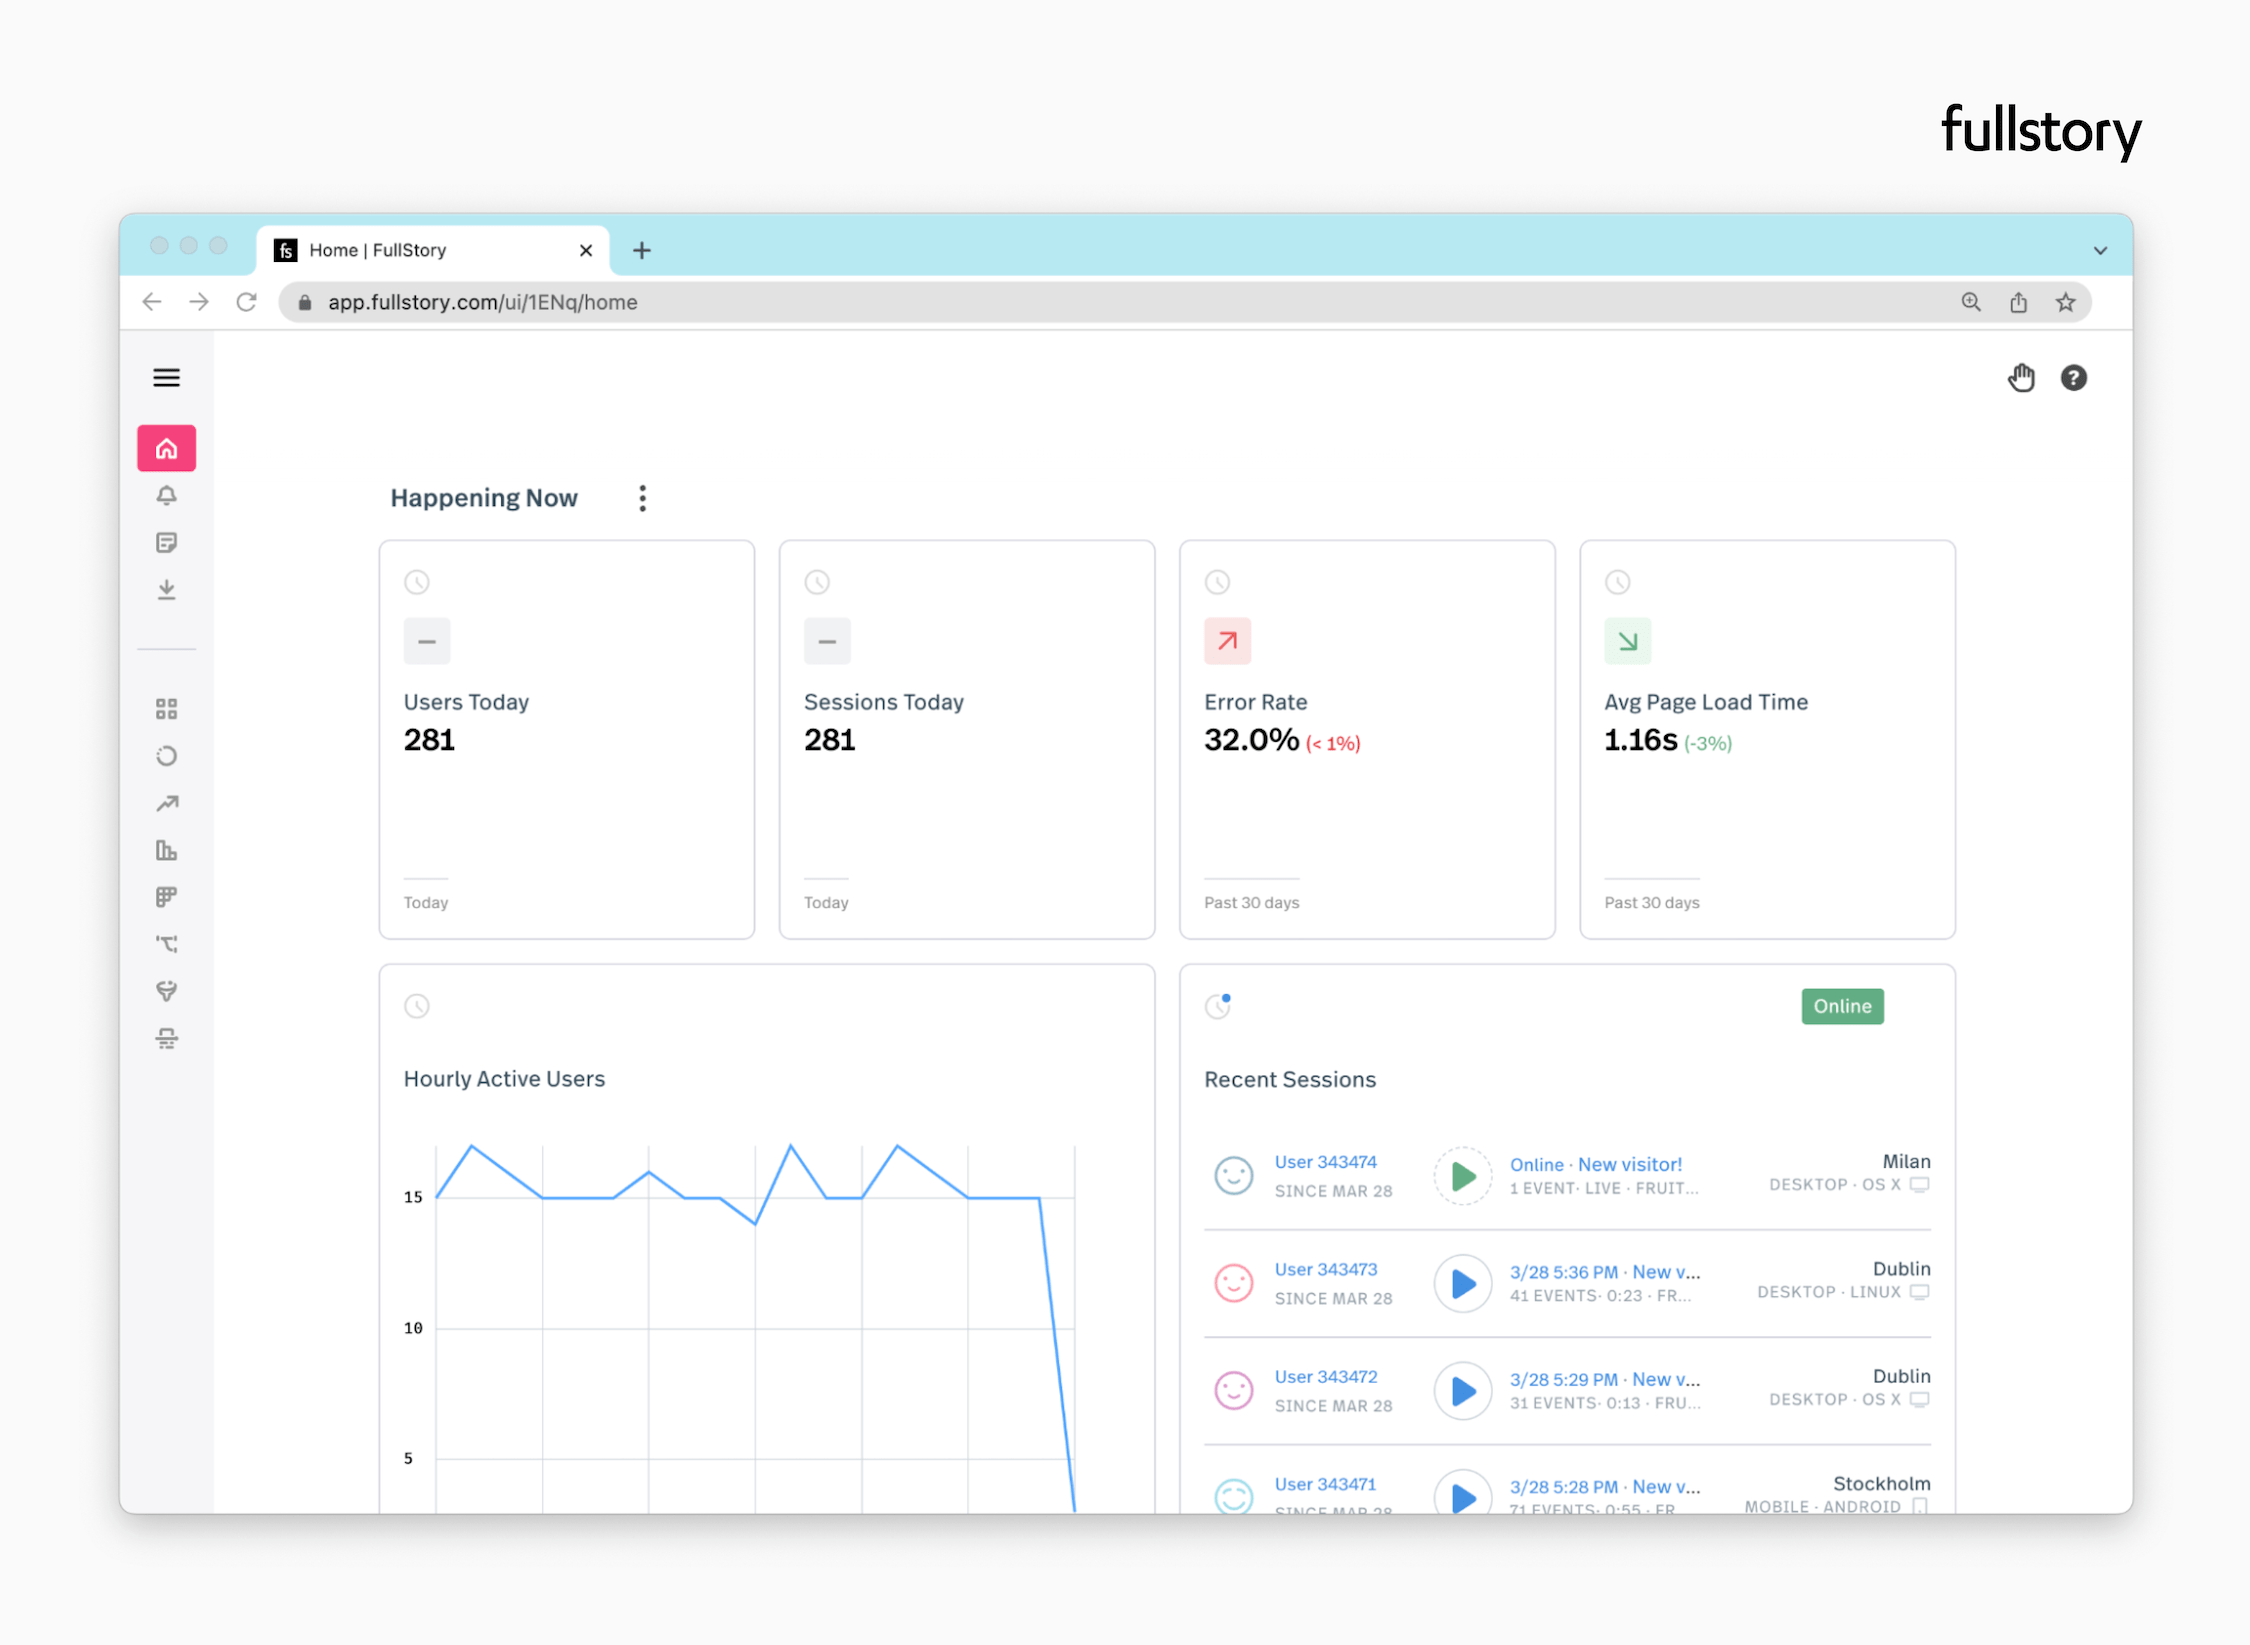
Metrics provide insight into how visitors interact with your website. They indicate where problems originate and highlight areas needing improvement. With this data, you can optimize your website to create the best user experience possible—all while increasing conversions and sales.
Website analytics are about more than just numbers. They can also tell you what people like and don’t like about your site, and the areas that need improvement.
True website analysis combines both qualitative and quantitative data to understand the what and why behind user behavior.
Trying to make sense of so much data can certainly be a challenge, especially early in your website’s life. However, understanding the basics and what you should track is key to creating a successful online presence.
Importance of web analytics
The primary key to web analytics is understanding the importance of data. Without complete data, it’s impossible to accurately measure successes or failures. Web analytics are important for many reasons, including:
Analyzing user behavior and preferences: Analyzing user behavior is essential for optimizing a website for conversions. What are users clicking on? What are they ignoring? Where are they going and from where? And why? Site analytics can provide these answers.
Gaining insights into how people find your site: Knowing where people find and access your site is key to developing an effective SEO or PPC strategy.
Improving user experience: Web analytics can identify areas that need improvement, such as page loading times, navigation, or content. Taking the time to improve these areas can have a huge impact on user experience.
Making data-driven decisions: With web analytics, you can make data-informed decisions about the direction of your website and marketing campaigns. Guessing what you should be doing is a fool’s errand.
Scaling analytics across the organization: Enterprise analytics solutions enable large businesses to centralize data from multiple sources, providing a comprehensive view of user behavior across various digital properties and campaigns."
It’s important to use the right tools and resources to get started with website analytics. Fortunately, many tools and resources are available that can help you track website traffic and gain insight into customer behavior. First, examine the following examples of web analytics.
Web analytics examples
Examples of web analytics are a great way to gain an understanding of what you should be tracking. The following are some of the most common web analytics metrics:
Pageviews
One of the single most crucial site analytics metrics is pageviews. A pageview is counted each time a browser loads a page on your site.
Pageview counts tell the number of times a specific page was viewed, including multiple views from the same visitor.
It’s important to note that a high number of views doesn’t necessarily mean a post is popular. It could also mean that a page was confusing and visitors had to return to it multiple times.
Unique pageviews
Another important web analytics metric is unique pageviews, which refer to the total number of times a page was viewed by users in a single visit.
If a person views the same page more than once within one session, it will still only be counted as one unique pageview. It’s worth noting, as well, that reloaded sessions are not tracked in unique pageviews.
Accurately recording unique pageviews is crucial. It helps measure users' genuine engagement with your website and gives a better idea of how many people are actually clicking through your pages.
Sessions
As your users log in and interact with your website, their activities form a “session.” Sessions are simply groupings of user interactions. They comprise everything from pageviews to CTA clicks, downloads, and events.
The timeframe of a session varies by web analytics tool. Usually, sessions end after 30 minutes of inactivity or when the user visits your site via another source. Please be aware that other instances will end the user session, like:
Midnight: When the internal clock strikes midnight, the users’ sessions end.
Returning from a different traffic source: If a user leaves and returns from another source (i.e., returning after leaving via an email link), the session will end.
Additionally, you can set custom time frames to define how long a single session can last. This is helpful for understanding user behavior and engagement across different channels.
New visitors
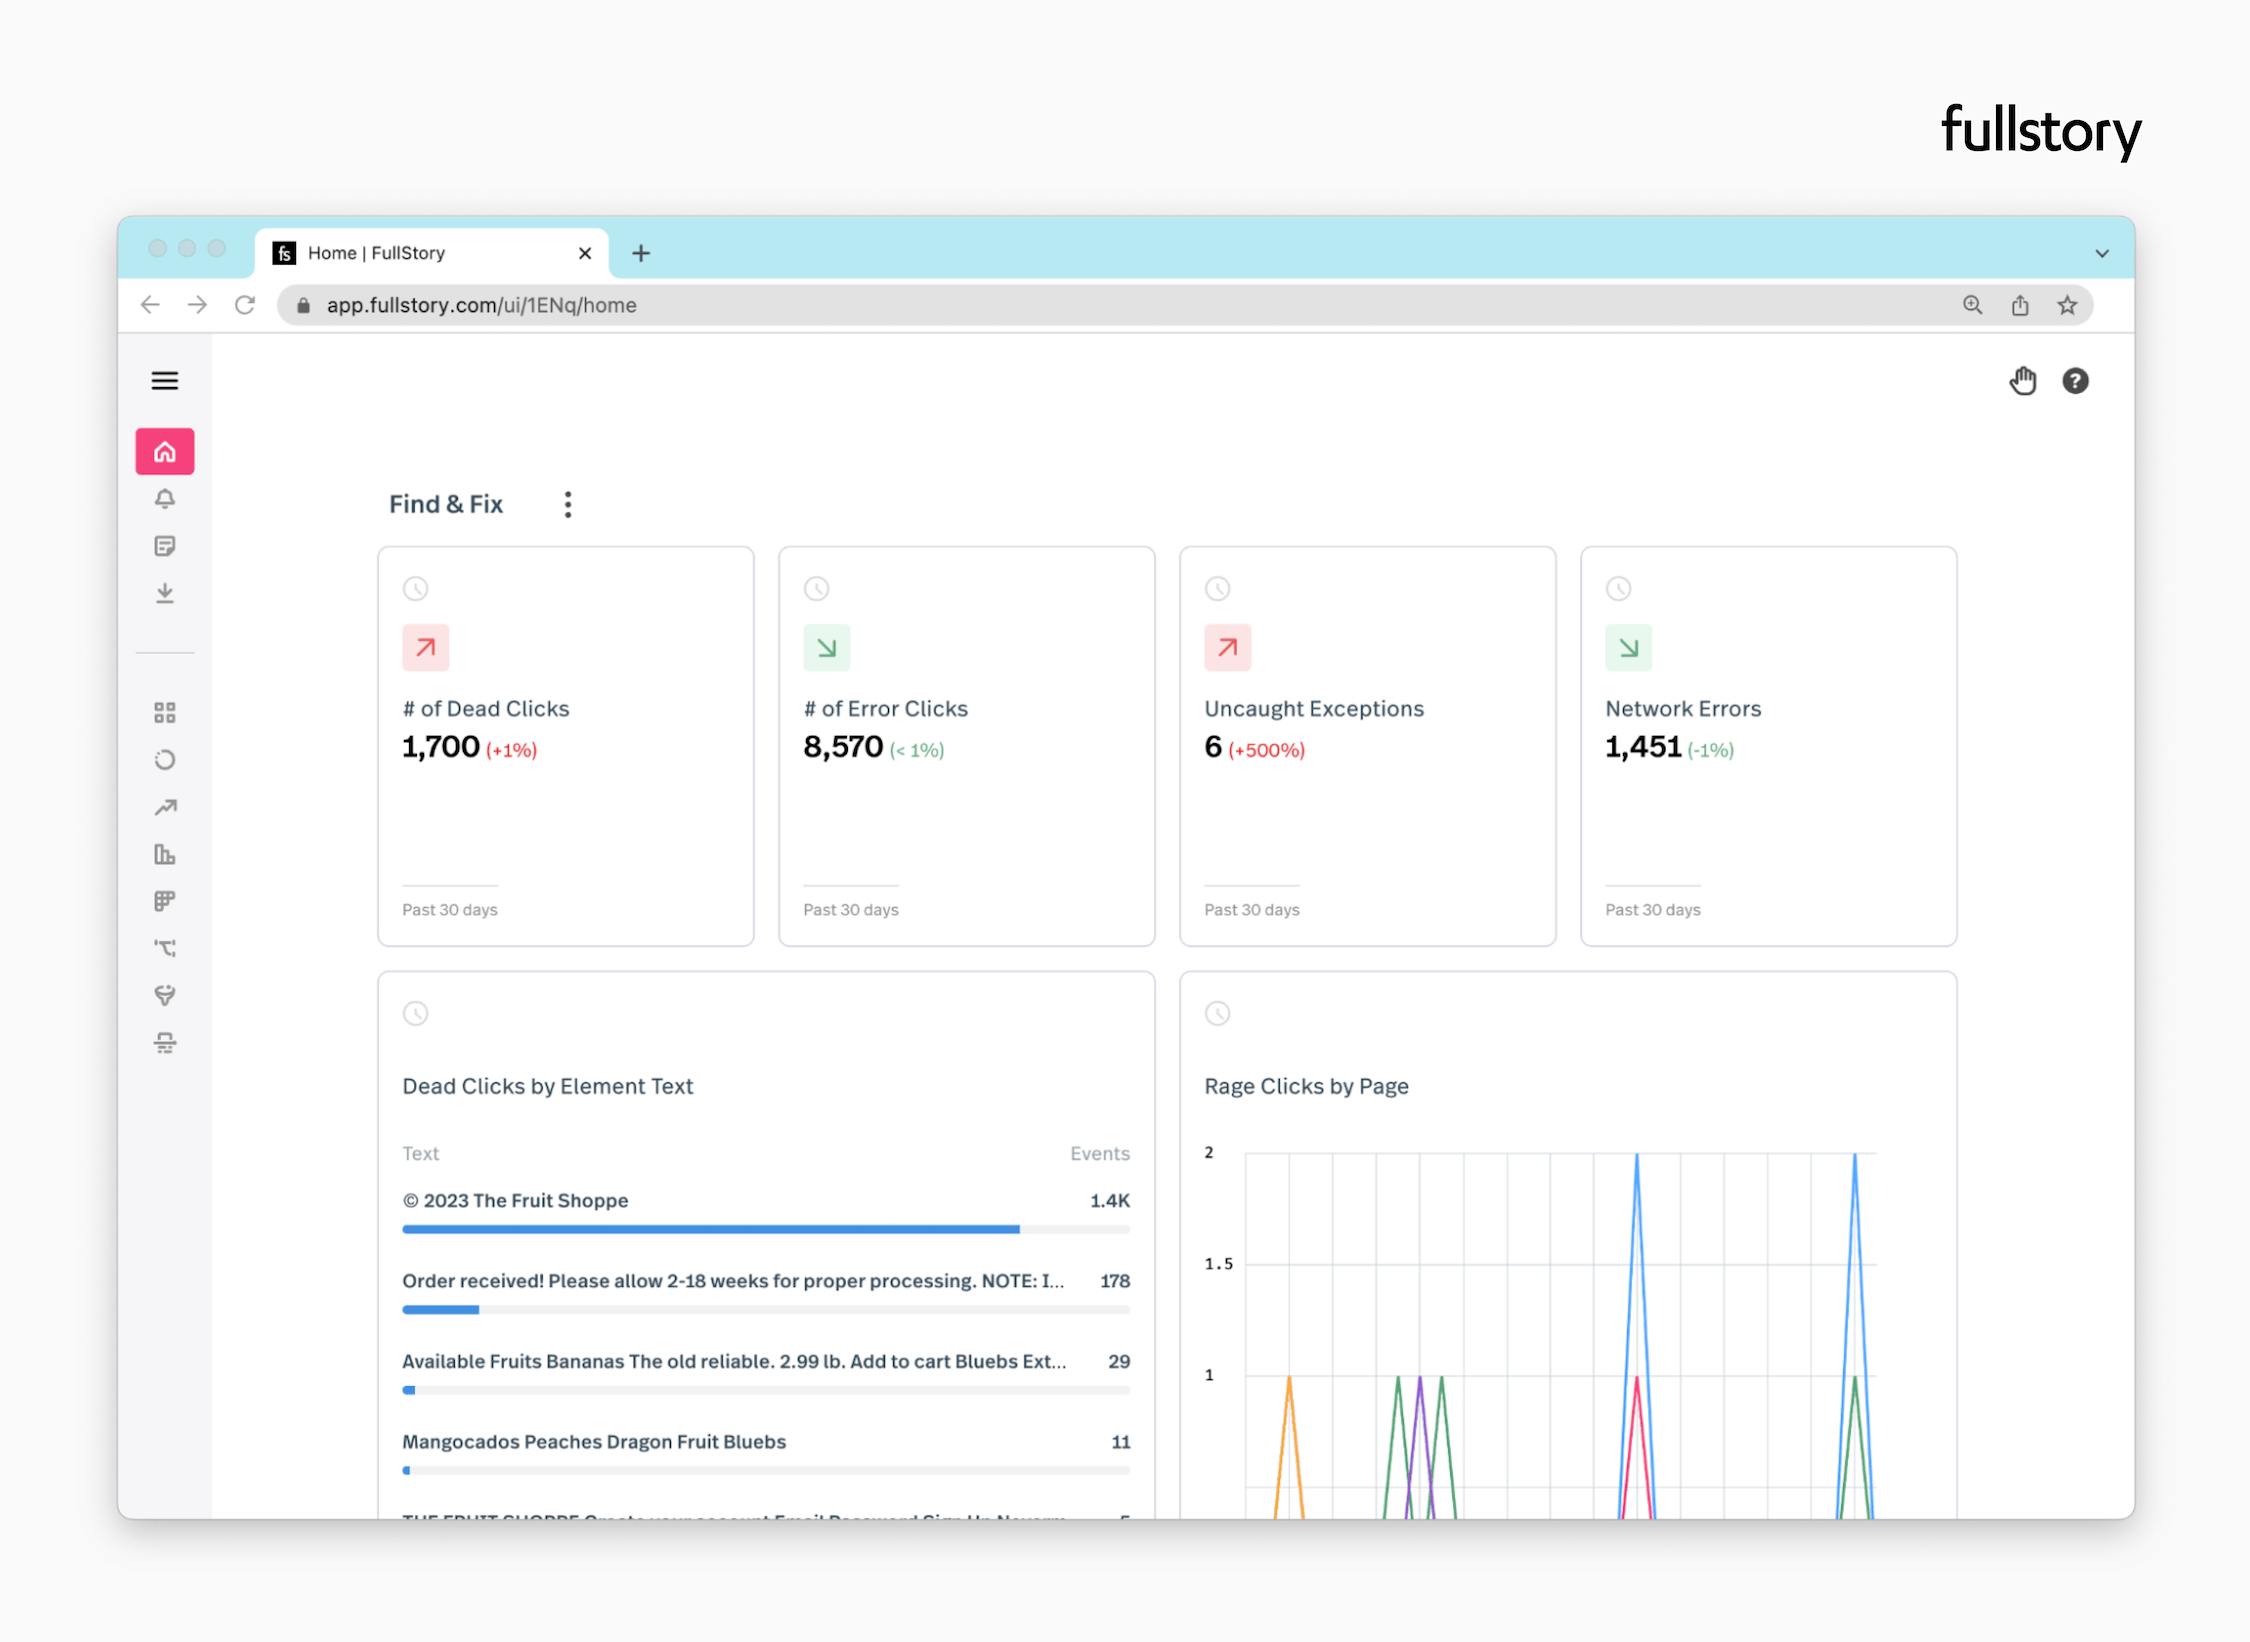
New visitors are the number of unique visitors to your website—a single visitor can have multiple sessions, but a unique visitor’ll identify them.
It's important to track the number of new visitors over time to see how your website is growing.
Returning visitors
Just as new visitors are important, so too are returning visitors. Users who come back to your website are likely to be more engaged with it and more likely to convert.
The number and rate of returning visitors can be tracked over time. This information can help you understand how effective your website is in engaging visitors.
Traffic sources
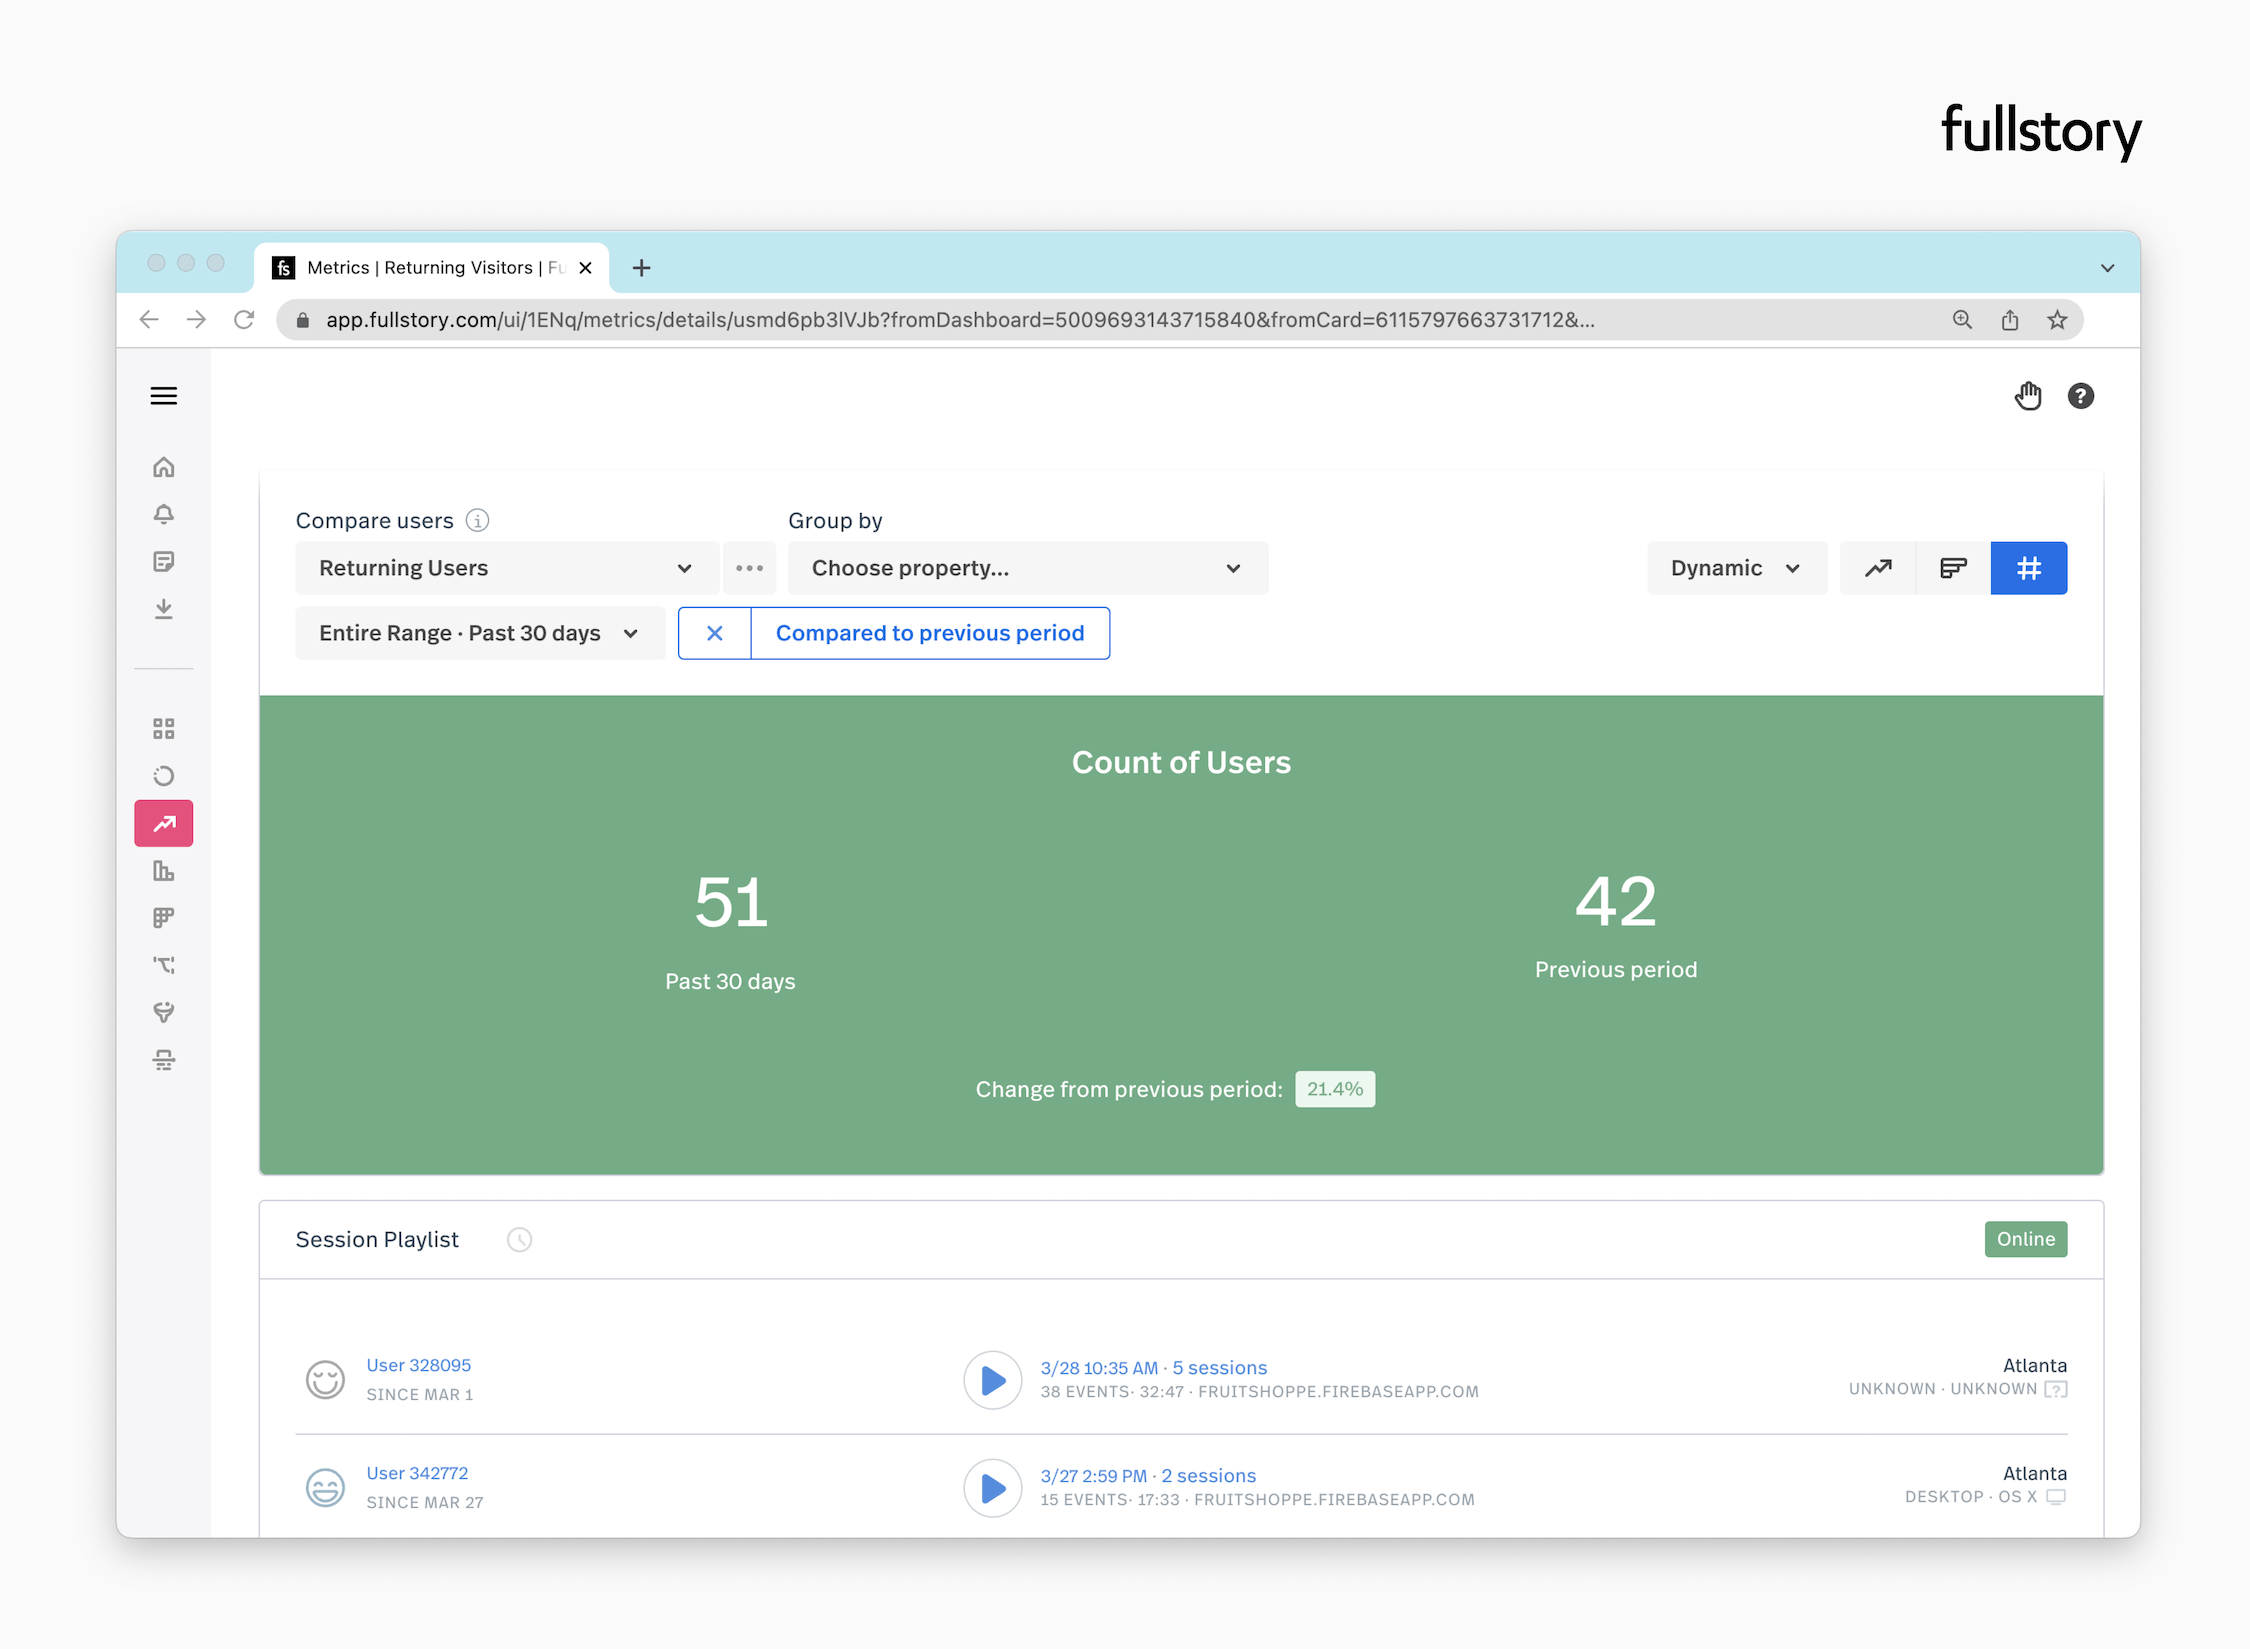
The sources of your website’s traffic can tell you a lot about how people are finding and accessing your site.
Trackable traffic sources include organic search, paid search, referrals from other websites, and social media. Understanding traffic sources can help you optimize your website’s content and marketing campaigns for maximum efficiency.
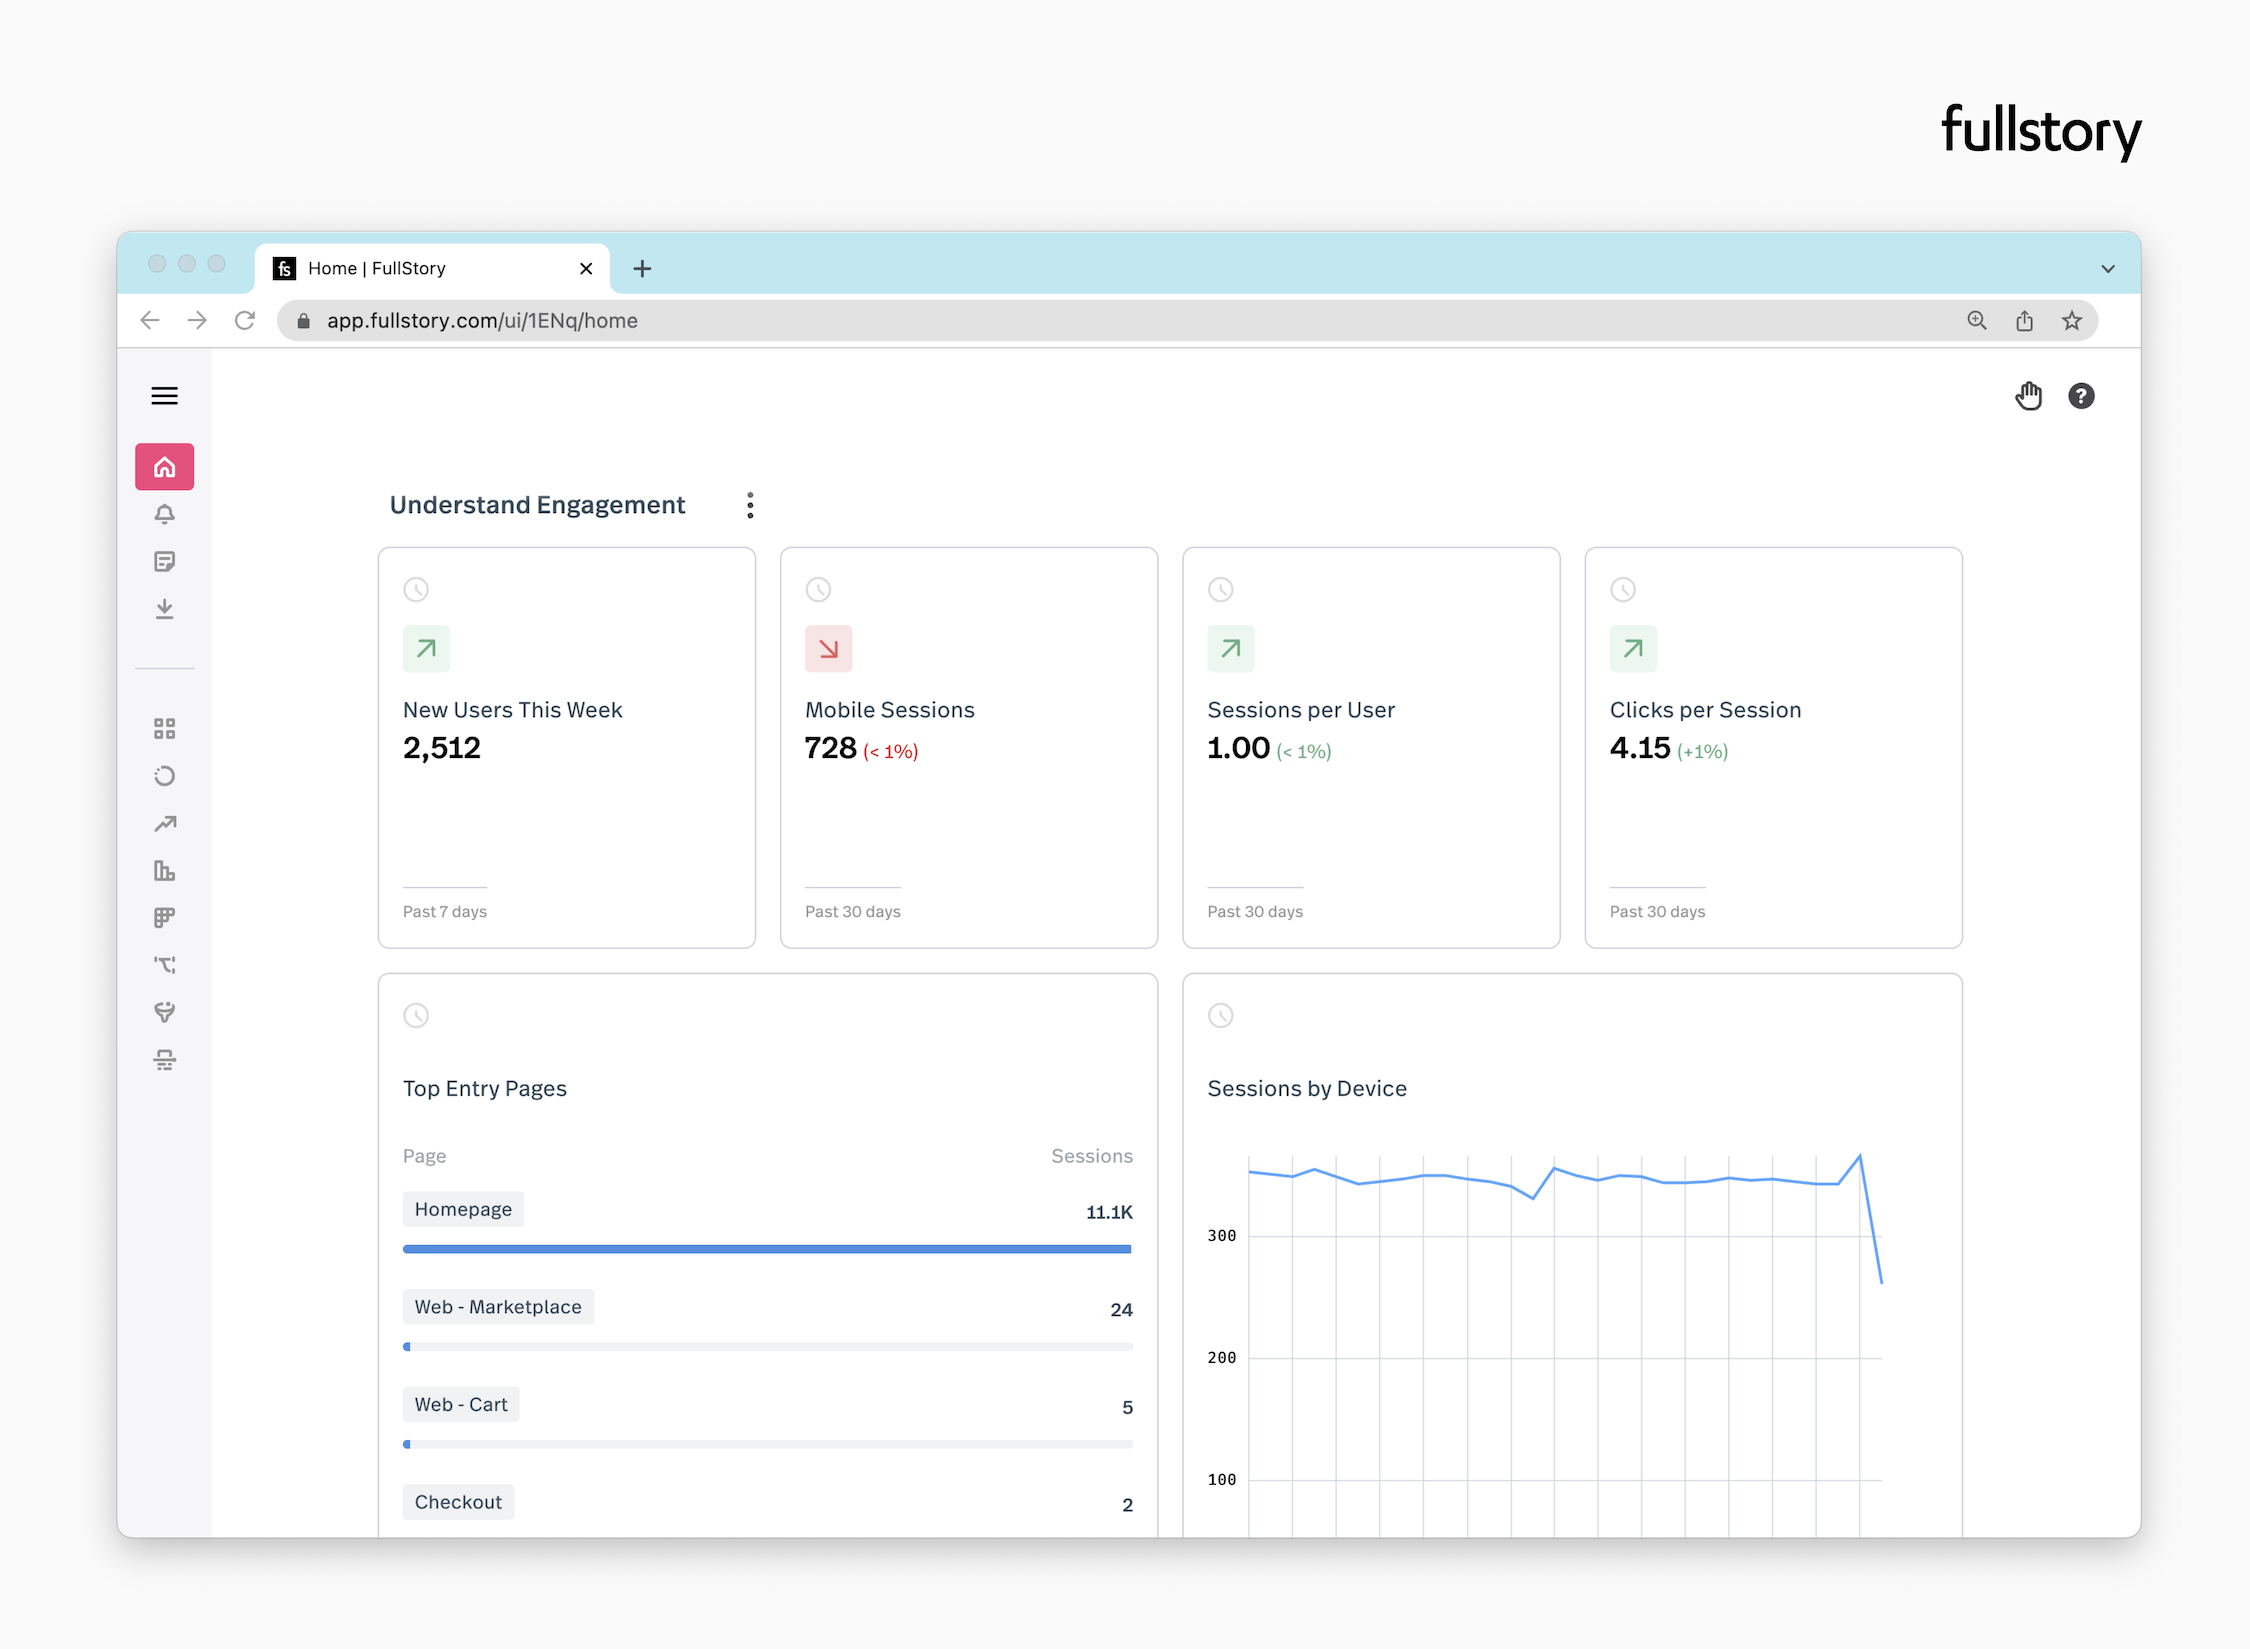
Bounce rate
Bounce rate refers to visitors who, in general, don’t stay around to check out more of your website after initiating a pageview. It’s often calculated as how many visitors view one page and then leave, but definitions can vary.
As such, said visitor will come to your website to view a single page and then leave without further exploration. A high bounce rate might not be engaging with your site how you envisioned, and thus, changes might be necessary.
On the other hand, a low bounce rate indicates that visitors are engaged and spending time exploring your site. This can often indicate successful content or an effective marketing campaign.
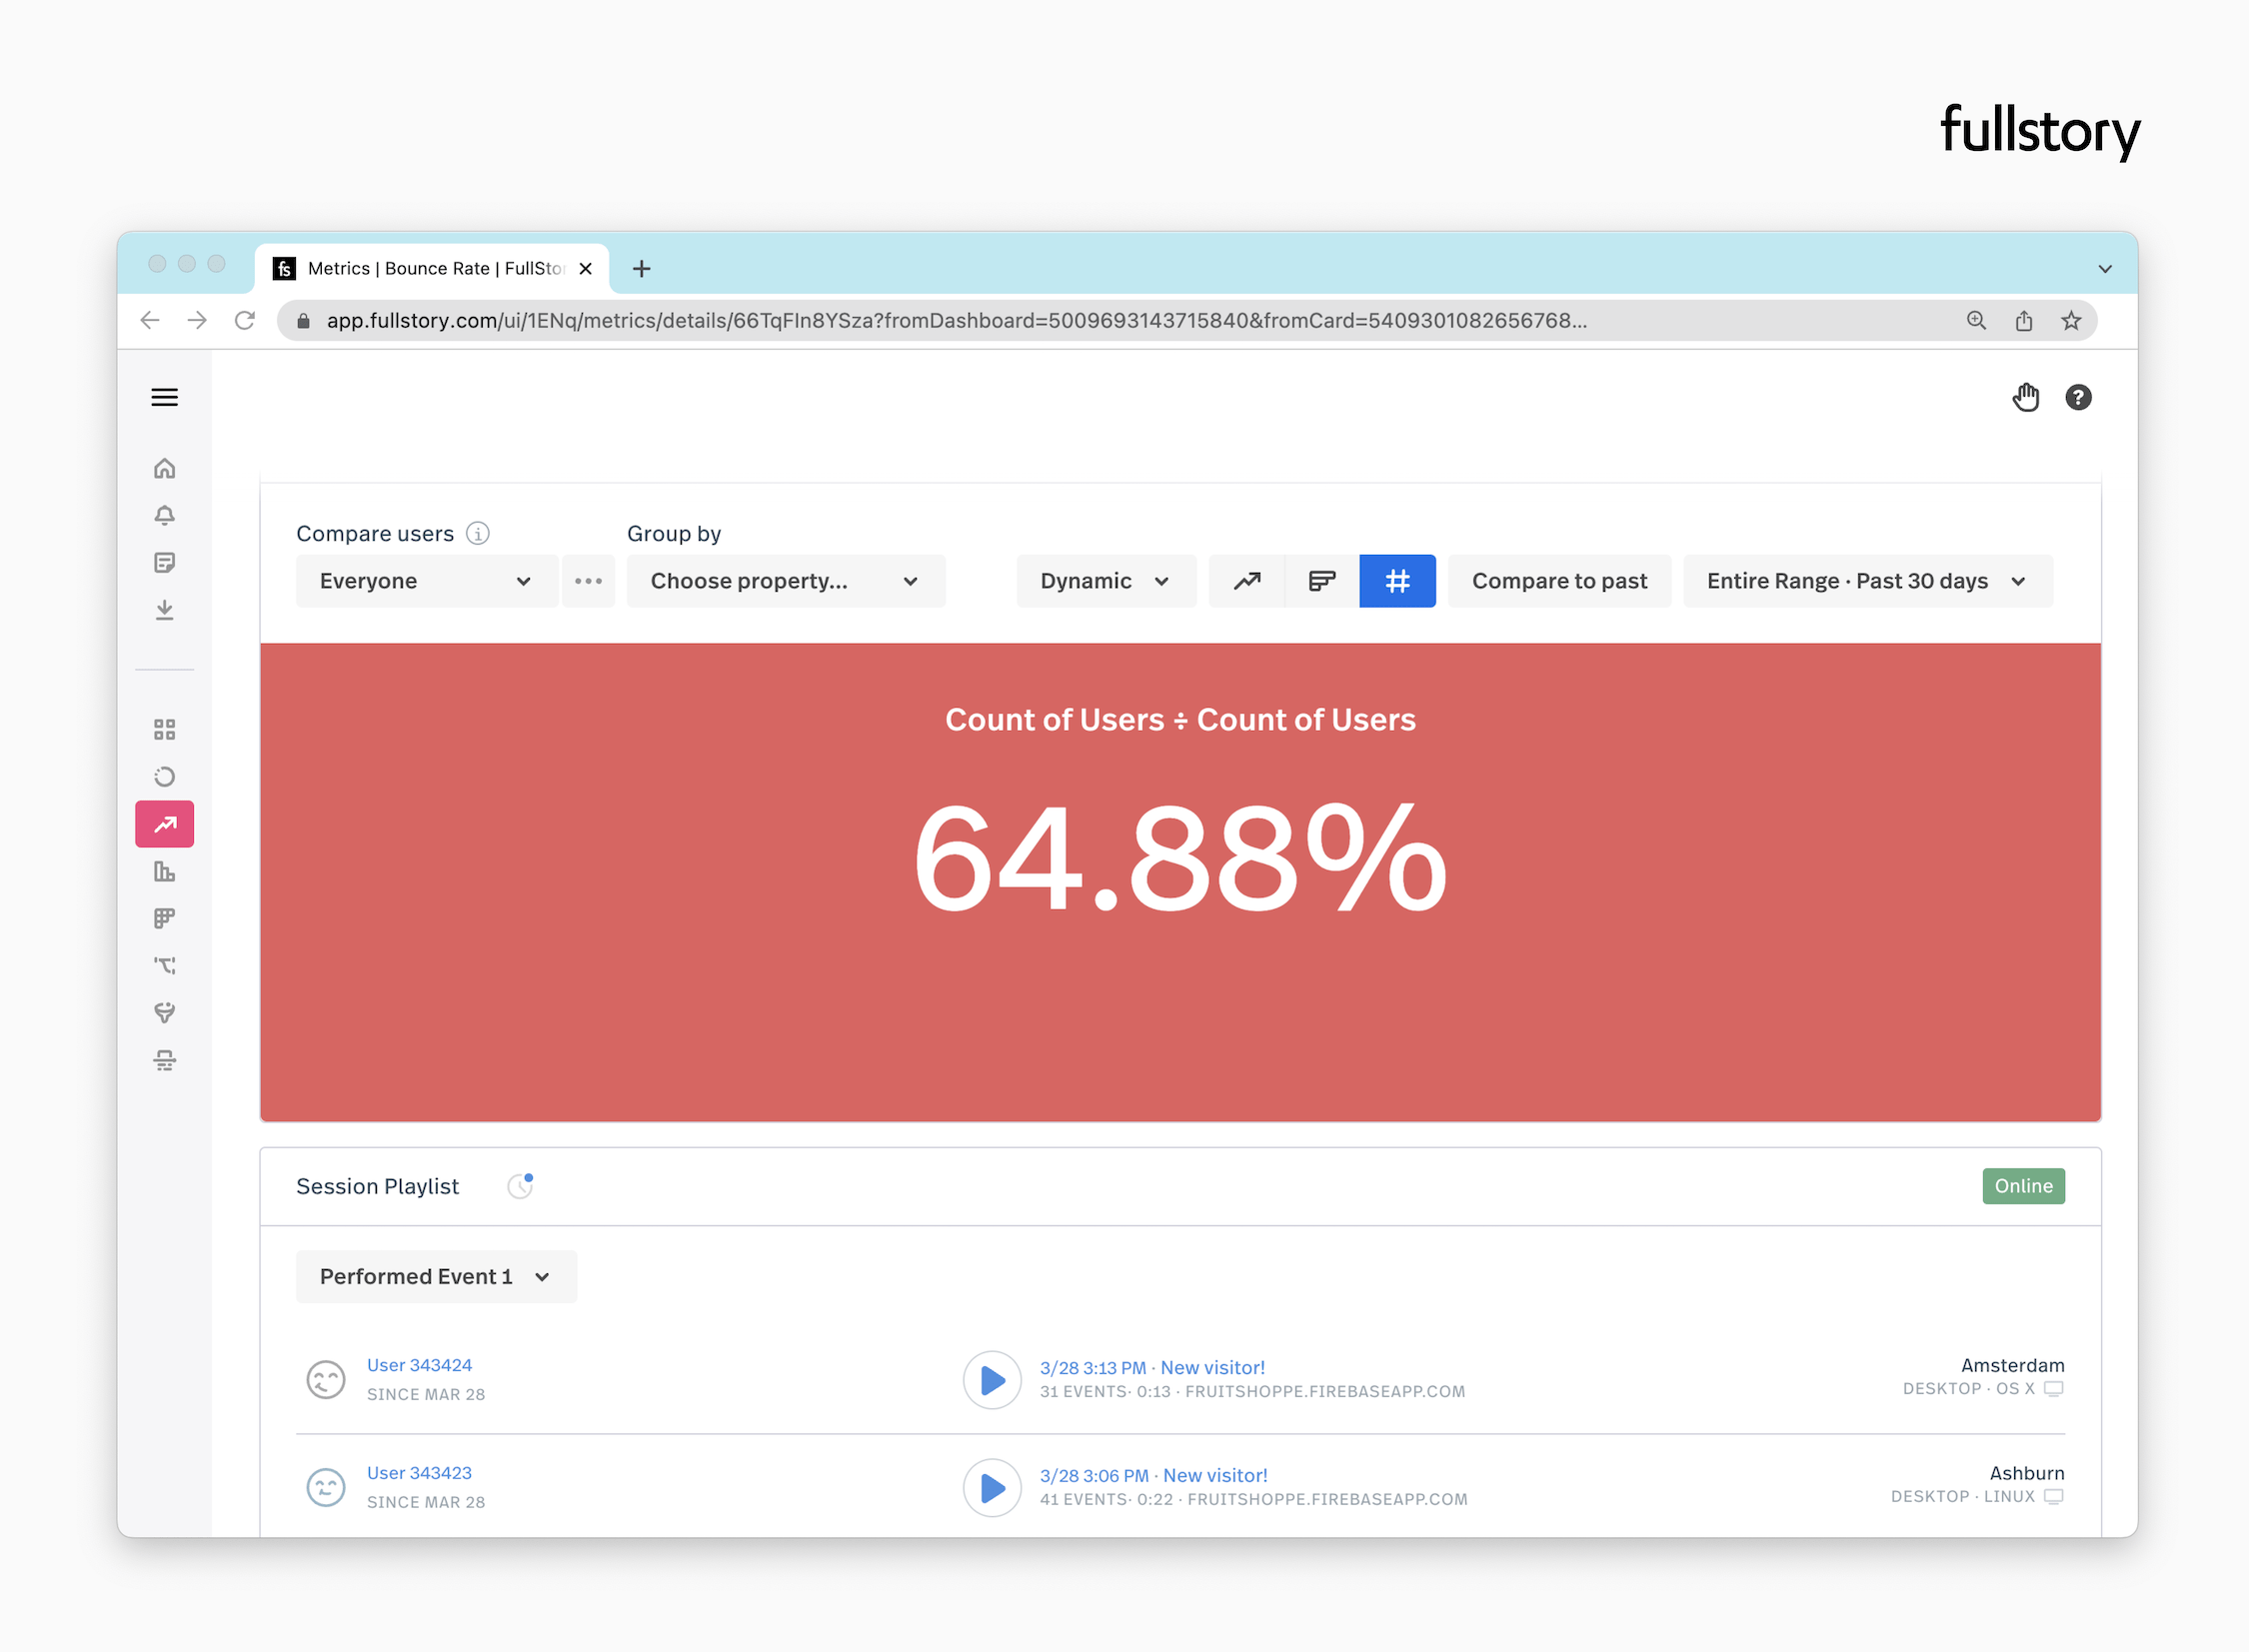
There are established bounce rates that generally signify a good or bad rate of visitors who leave your website after viewing one page.
If your website’s bounce rate is 40% or lower, it’s a good indication that your content and marketing efforts are working.
Conversely, a bounce rate of 40% to 70% is considered average, while anything higher than 70% shows that visitors are not staying on your website.
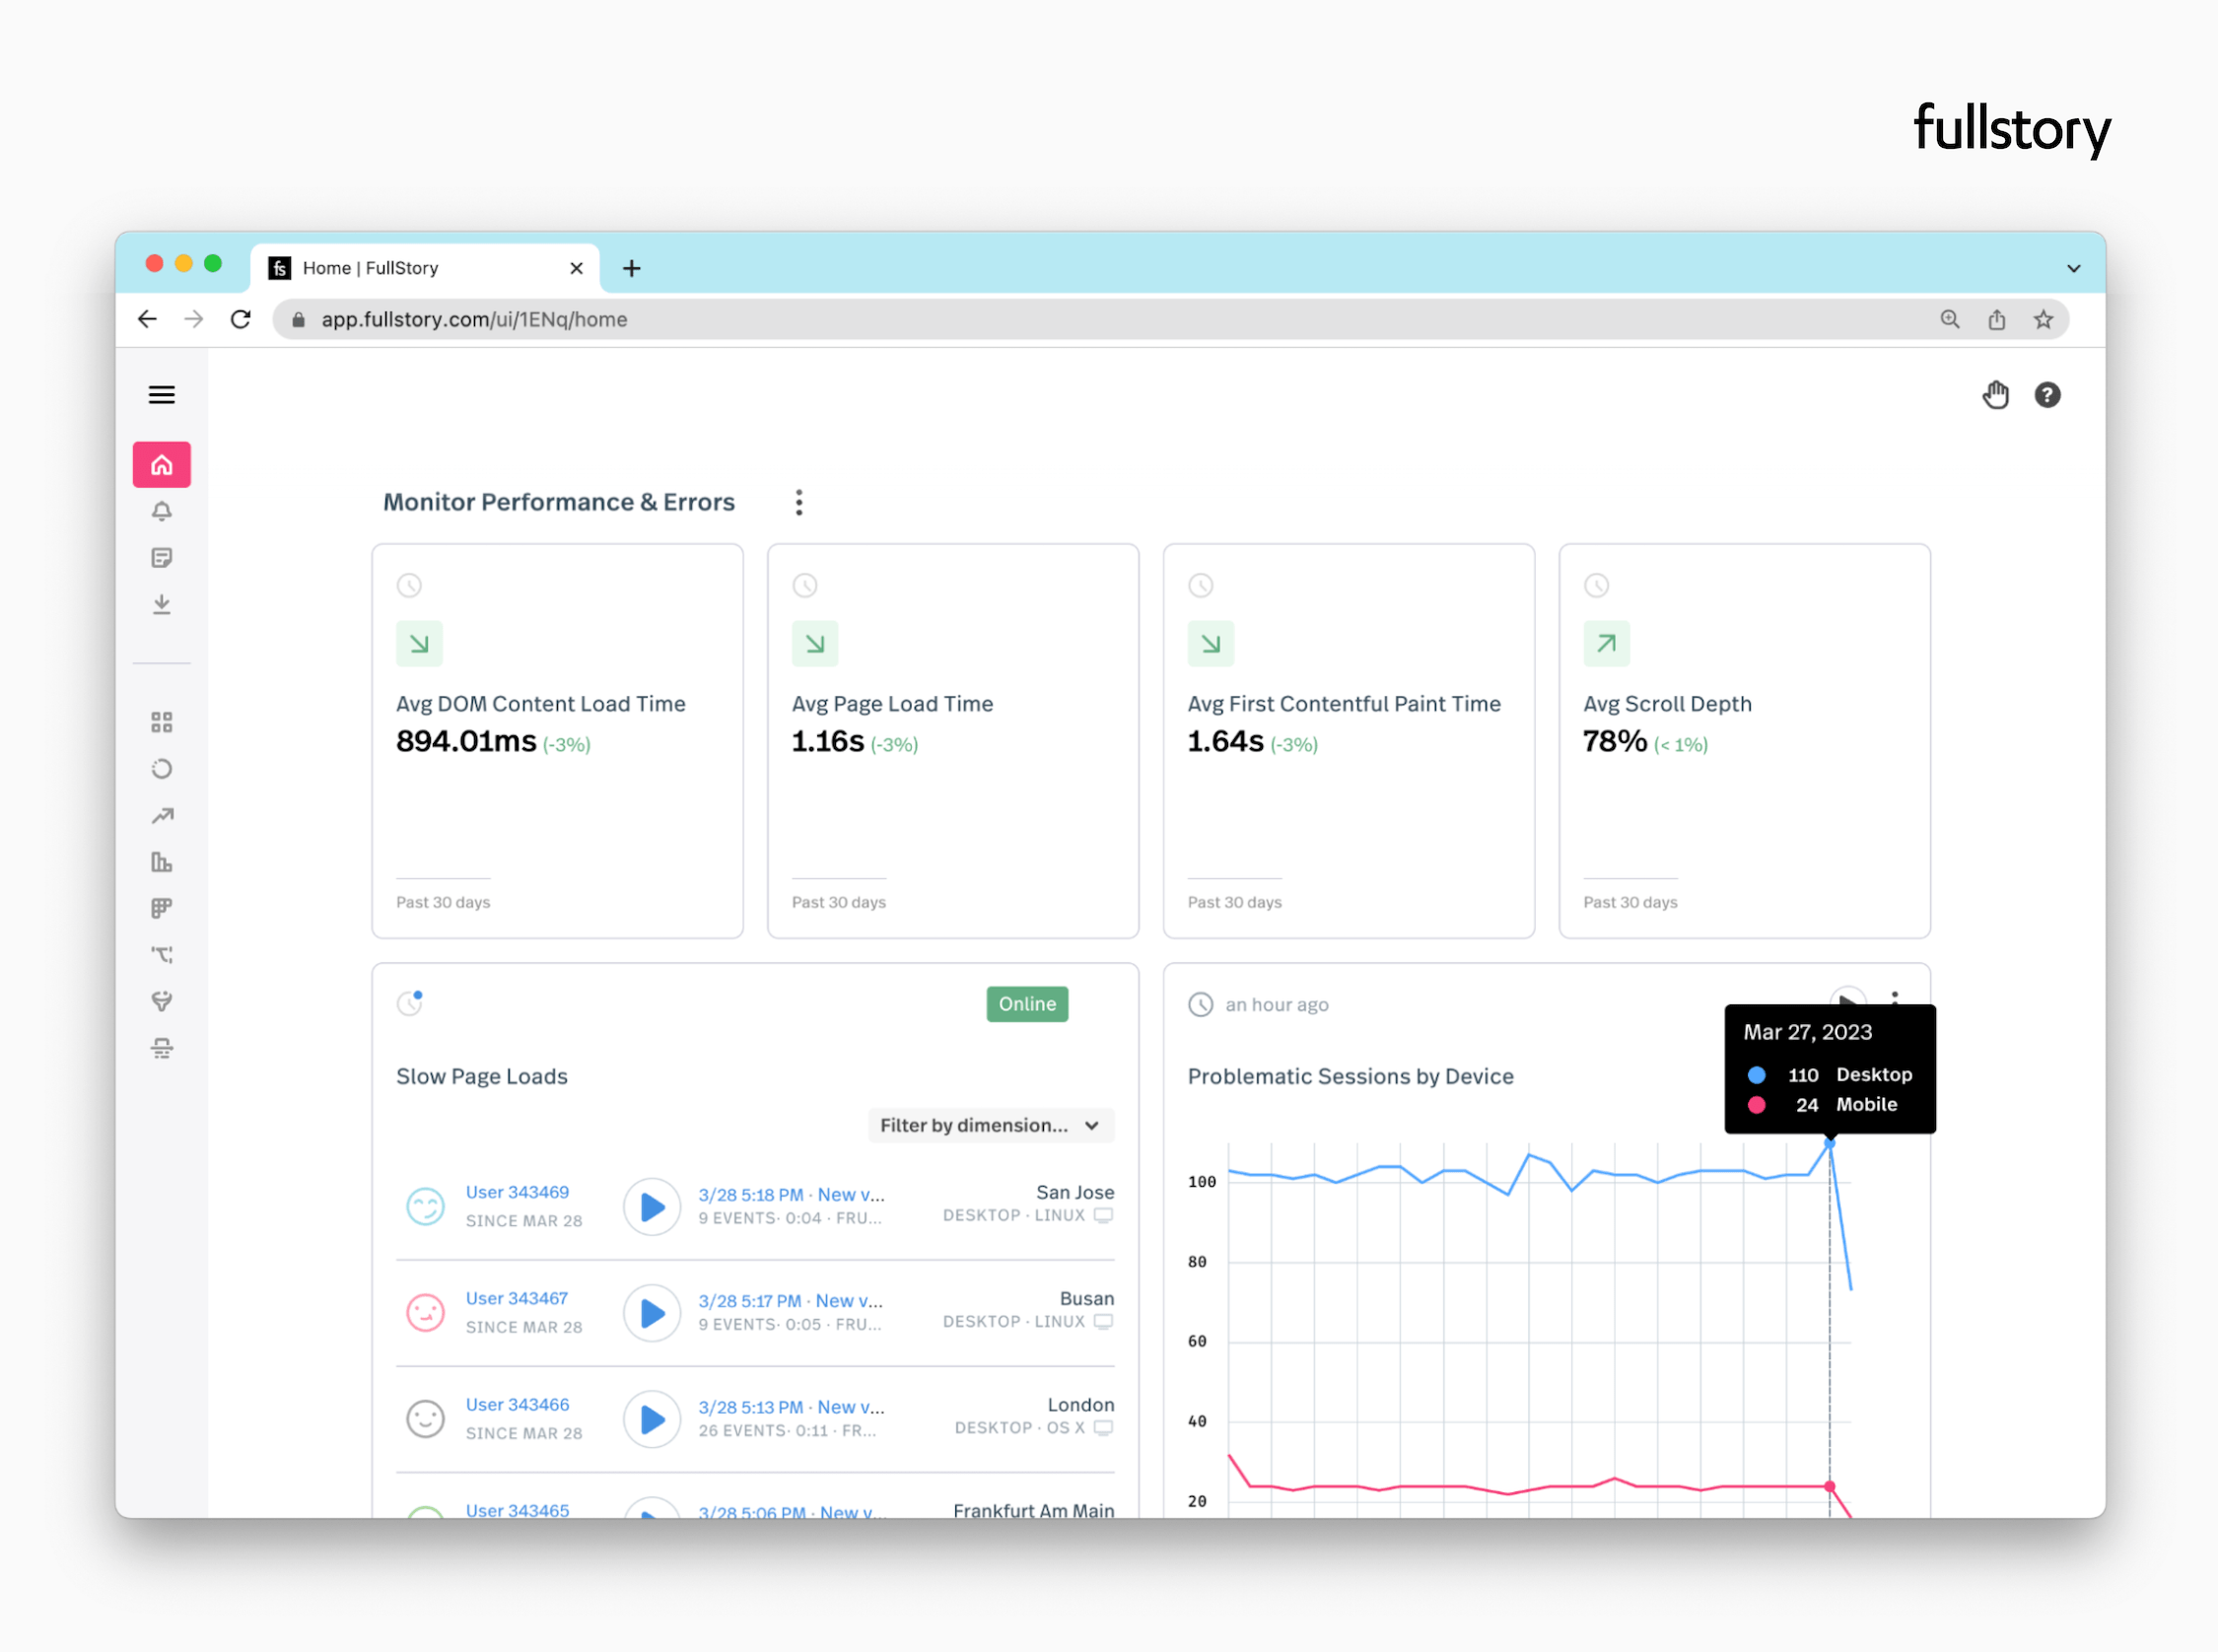
The best way to analyze website analytics is through tools specifically designed for it. These tools can provide a comprehensive view of website performance and help you make data-driven decisions. With clear insights into user behavior, you can improve your website’s user experience and optimize your marketing campaigns for maximum efficiency.
How web analytics work
Web analytics is a method for collecting, measuring, analyzing, and reporting data about website usage. It provides valuable insights into user behavior, website traffic, and other website-related metrics that help businesses optimize their online presence. Web analytics tools work by collecting data on user behavior, such as the number of visitors, page views, and clicks on links.
To collect this data, web analytics tools use a code snippet—often called a tag—placed on every site page. The tag collects data such as the user’s device type, browser, and geographic location, which is determined through the user’s IP address.
Some analytics services use cookies to track individual sessions and to determine repeat visits from the same browser.
Although web analytics tools are generally effective at collecting data, they are not perfect. Some users delete cookies, and different browsers have various restrictions around code snippets, which can cause slightly different results between analytics platforms.
Despite the limitations, web analytics tools remain a critical part of website conversion rate optimization.
Web analytics best practices
To get the most out of web analytics, businesses should follow some best practices. Here are some of the most important ones:
Pick suitable metrics: Businesses should identify key performance indicators (KPIs) that are most relevant to their business objectives. Tools like Fullstory’s autocapture feature can help track all metrics automatically.
Plan business objectives and strategies: Businesses should use data to drive decision-making and base all experiment hypotheses on data. They should use data for A/B testing decisions, experimentation, and making changes. This data can also be used to identify high-value content, showing which content to focus on first.
Don’t limit your focus to traffic
Businesses should always pair data with insights. Reporting only the numbers provides an incomplete picture of website performance. For example, if a website’s traffic is increasing but the conversion rate is decreasing, it could indicate a UX problem.
Look at your data in context
It’s essential to analyze data in the right context to avoid making incorrect decisions. Algorithm updates, seasonality, and bots can all have a significant impact on website traffic and other metrics.
Share and ask for feedback from stakeholders
Businesses should provide information to stakeholders in a way that is understandable and actionable. They should ask for information and ideas from stakeholders, who can provide valuable feedback on how they use the data and how they think they can improve the user experience or other issues the data uncovers.
What to look for in a web analytics tool
When selecting a web analytics tool, businesses should consider the following factors:
Features: It’s essential to consider the features that are most relevant to the business objectives. The tool should offer the ability to track conversions, monitor website traffic, measure user engagement, and track visitor behavior.
Data capture: Complete data capture is also essential, enabling the tool to gather all the data you need to understand website visitors and user behavior.
Reporting capabilities: The tool should be able to provide meaningful reports that help businesses gain insights into improving website performance.
How to choose the right web analytics software
To choose the right web analytics software, consider the following:
Preferences and requirements: Businesses should identify their preferences and requirements and select a tool that meets their needs.
Number of features: The tool should offer the required features to help businesses achieve their business objectives.
Pricing model: The pricing model should be reasonable and cost-effective.
Support: The vendor should provide good customer support to help businesses make the most of the tool.
Take each of these factors into account to better select the most suitable software for your business’s needs.
The most popular web analytics platforms
Some of the best web analytics tools on the market:
Fullstory
Fullstory is a behavioral data platform that offers a range of features, including session replay, heatmaps, and conversion tracking. It provides businesses with critical insights into user behavior and website performance.
A free trial is available to help you get started.
Mixpanel
Mixpanel also provides user-level analytics and data tracking. Businesses can then track user behavior, measure engagement, and adjust their websites.
Hotjar
Hotjar offers heatmaps, session replays, and user feedback tools. Hotjar’s tools further optimize the user experience.
Semrush
Semrush provides search engine optimization (SEO) and SEM tools, including keyword research, competitor analysis, and site audit features. It helps businesses optimize their online presence and improve their search engine rankings.
Ahrefs
Ahrefs provides SEO and backlink analysis tools. It offers businesses insights into their online presence and helps them improve their search engine rankings.
Free web analytics tools
Some free web analytics tools in the market include:
Google Analytics
Google Analytics is a free web analytics tool that provides businesses with insights into website traffic, user behavior, and conversion tracking.
Google Search Console
Google Search Console is a free tool that helps businesses monitor their website’s presence in Google search results. It offers insights into website traffic, search engine rankings, and website errors.


