Data is all around us, and every day it becomes increasingly important. Different types of data define more and more of our interactions with the world around us—from using the internet to buying a car, to the algorithms behind news feeds we see, and much more.
One of the most common and well-known categories of data is quantitative data or data that can be expressed in numbers or numerical values.
This guide takes a deep look at what quantitative data is, what it can be used for, how it’s collected, its advantages and disadvantages, and more.
Key takeaways:
Quantitative data is data that can be counted or measured in numerical values.
The two main types of quantitative data are discrete data and continuous data.
Height in feet, age in years, and weight in pounds are examples of quantitative data.
Qualitative data is descriptive data that is not expressed numerically.
Both quantitative research and qualitative research are often conducted through surveys and questionnaires.
What is quantitative data?
Quantitative data is information that can be counted or measured—or, in other words, quantified—and given a numerical value.
Quantitative data is used when a researcher needs to quantify a problem, and answers questions like “what,” “how many,” and “how often.” This type of data is frequently used in math calculations, algorithms, or statistical analysis.
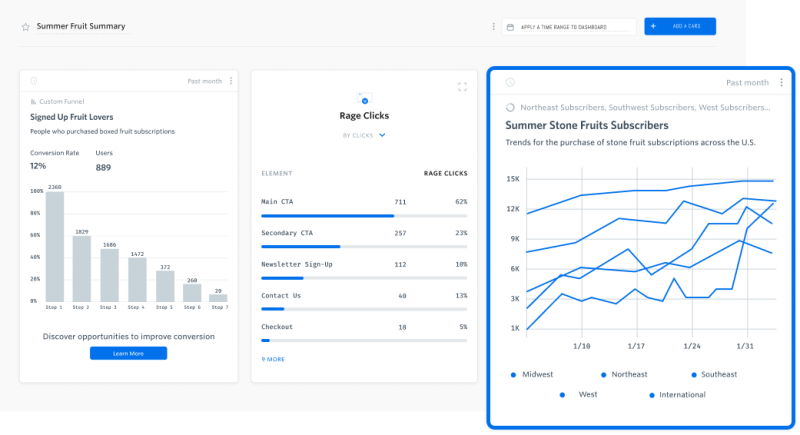
In product management, UX design, or software engineering, quantitative data can be the rate of product adoption (a percentage), conversions (a number), or page load speed (a unit of time), or other metrics. In the context of shopping, quantitative data could be how many customers bought a certain item. Regarding vehicles, quantitative data might be how much horsepower a car has.
What are examples of quantitative data?
Quantitative data is anything that can be counted in definite units and numbers. So, among many, many other things, some examples of quantitative data include:
Revenue in dollars
Weight in kilograms or pounds
Age in months or years
Distance in miles or kilometers
Time in days or weeks
Experiment results
Website conversion rates
Website page load speed
What is the difference between quantitative and qualitative data?
There are many differences between qualitative and quantitative data—each represents very different data sets and are used in different situations. Often, too, they’re used together to provide more comprehensive insights.
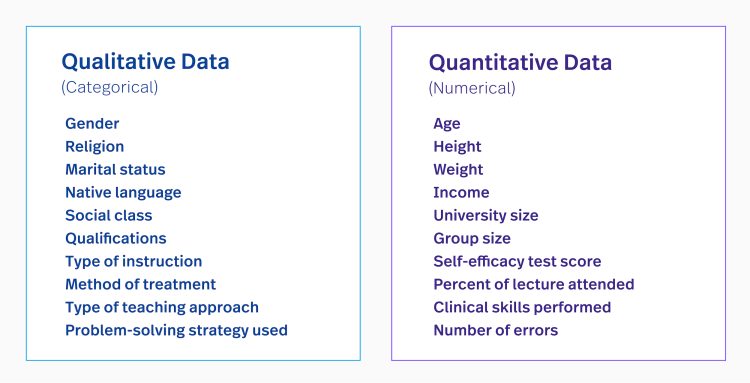
As we’ve described, quantitative data relates to numbers; it can be definitively counted or measured. Qualitative data, on the other hand, is descriptive data that are expressed in words or visuals. So, where quantitative data is used for statistical analysis, qualitative data is categorized according to themes.
Examples of qualitative vs. quantitative data
As mentioned above, examples of quantitative data include distance in miles or age in years.
Qualitative data, however, is expressed by describing or labeling certain attributes, such as “chocolate milk,” “blue eyes,” and “red flowers.” In these examples, the adjectives chocolate, blue, and red are qualitative data because they tell us something about the objects that cannot be quantified.
Further reading: The differences between categorical and quantitative Data and examples of qualitative data
Characteristics of quantitative data
Quantitative data is made up of numerical values has numerical properties, and can easily undergo math operations like addition and subtraction. The nature of quantitative data means that its validity can be verified and evaluated using math techniques.
Specific types of quantitative data
All quantitative data can be measured numerically, as shown above. But these data types can be broken down into more specific categories, too.
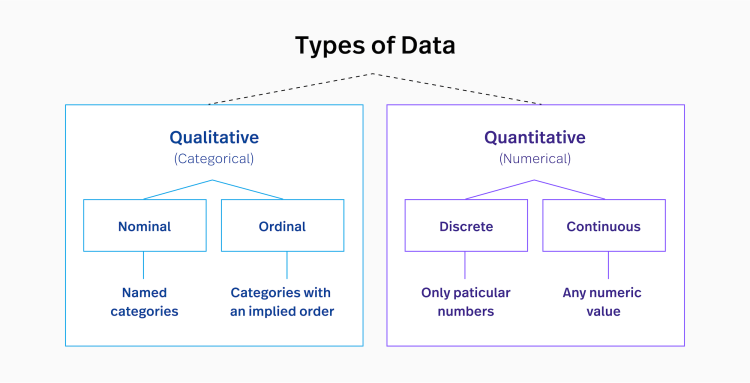
There are two types of quantitative data: discrete and continuous. Continuous data can be further divided into interval data and ratio data.
Discrete data
In reference to quantitative data, discrete data is information that can only take certain fixed values. While discrete data doesn’t have to be represented by whole numbers, there are limitations to how it can be expressed.
Examples of discrete data:
The number of players on a team
The number of employees at a company
The number of items eggs broken when you drop the carton
Shoe size
The number of outs a hitter makes in a baseball game
The number of right and wrong questions on a test
A website's bounce rate (percentages can be no less than 0 or greater than 100)
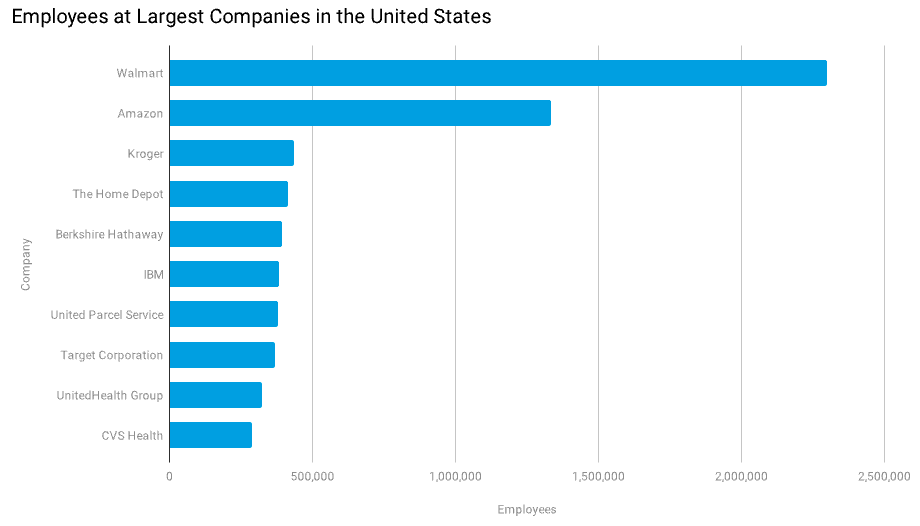
Discrete data is typically most appropriately visualized with a tally chart, pie chart, or bar graph, as shown below.
Continuous data
Continuous data, on the other hand, can take any value and varies over time. This type of data can be infinitely and meaningfully broken down into smaller and smaller parts.
Examples of continuous data:
Website traffic
Water temperature
Wind speed
The time it takes to complete a task
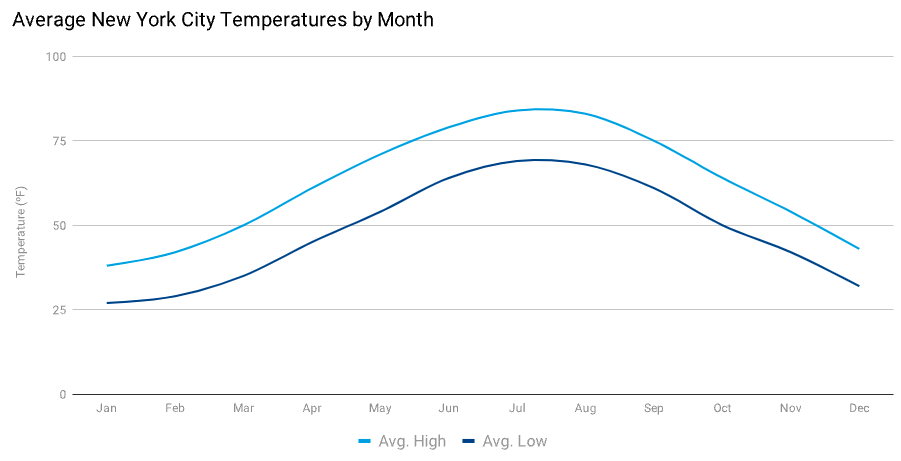
Because continuous data changes over time, its insights are best expressed with a line graph or grouped into categories, as shown below.
Continuous data can be further broken down into two categories: interval data and ratio data.
Interval data
Interval data is information that can be measured along a continuum, where there is equal, meaningful distance between each point on a scale. Interval data is always expressed in numbers where the distance between two points is standardized and equal. These numbers can also be called integers.
Examples of interval data include temperature since it can move below and above 0.
Ratio data
Ratio data has all the properties of interval data, but unlike interval data, ratio data also has a true zero. For example, weight in grams is a type of ratio data because it is measured along a continuous scale with equal space between each value, and the scale starts at 0.0.
Other examples of ratio data are weight, length, height, and concentration.
Interval data vs. ratio data
Ratio data gets its name because the ratio of two measurements can be interpreted meaningfully, whereas two measurements cannot be directly compared with intervals.
For example, something that weighs six pounds is twice as heavy as something that weighs three pounds. However, this rule does not apply to interval data, which has no zero value. An SAT score of 700, for instance, is not twice as good as an SAT score of 350, because the scale does not begin at zero.
Similarly, 40º is not twice as hot as 20º. Saying uses 0º as a reference point to compare the two temperatures, which is incorrect.
Start growing with data and Fullstory.
Request your personalized demo of the Fullstory behavioral data platform.
When should I use quantitative or qualitative research?
Quantitative and qualitative research can both yield valuable findings, but it’s important to choose which type of data to collect based on the nature and objectives of your research.
When to use quantitative research
Quantitative research is likely most appropriate if the thing you are trying to study or measure can be counted and expressed in numbers. For example, quantitative methods are used to calculate a city’s demographics—how many people live there, their ages, their ethnicities, their incomes, and so on.
When to use qualitative research
Qualitative data is defined as non-numerical data such as language, text, video, audio recordings, and photographs. This data can be collected through qualitative methods and research such as interviews, survey questions, observations, focus groups, or diary accounts.
Conducting qualitative research involves collecting, analyzing, and interpreting qualitative non-numerical data (like color, flavor, or some other describable aspect). Methods of qualitative analysis include thematic analysis, coding, and content analysis.
If the thing you want to understand is subjective or measured along a scale, you will need to conduct qualitative research and qualitative analysis.
To use our city example from above, determining why a city's population is happy or unhappy—something you would need to ask them to describe—requires qualitative data.
In short: The goal of qualitative research is to understand how individuals perceive their own social realities. It's commonly used in fields like psychology, social sciences and sociology, educational research, anthropology, political science, and more.
In some instances, like when trying to understand why users are abandoning your website, it’s helpful to assess both quantitative and qualitative data. Understanding what users are doing on your website—as well as why they’re doing it (or how they feel when they’re doing it)—gives you the information you need to make your website’s experience better.
Digital Leadership Webinar: Accelerating Growth with Quantitative Data and Analytics
Learn how the best-of-the-best are connecting quantitative data and experience to accelerate growth.
What are the pros and cons of quantitative data?
Quantitative data is most helpful when trying to understand something that can be counted and expressed in numbers.
Pros of quantitative data:
Quantitative data is less susceptible to selection bias than qualitative data.
It can be tested and checked, and anyone can replicate both an experiment and its results.
Quantitative data is relatively quick and easy to collect.
Cons of quantitative data:
Quantitative data typically lacks context. In other words, it tells you what something is but not why it is.
Conclusions drawn from quantitative research are only applicable to the particular case studied, and any generalized conclusions are only hypotheses.
How do you collect quantitative data?
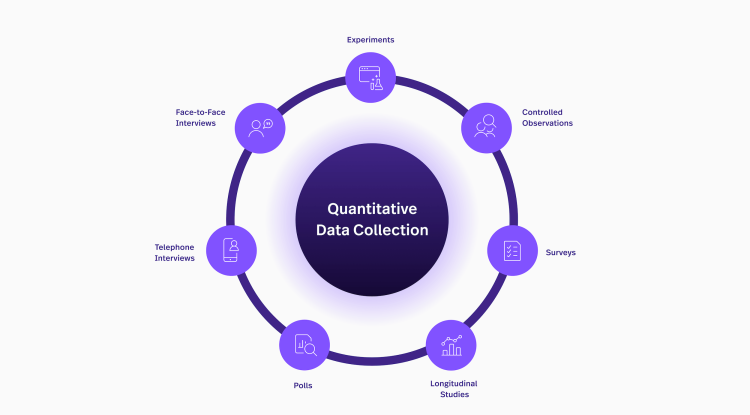
There are many ways to collect quantitative data, with common methods including surveys and questionnaires. These can generate both quantitative data and qualitative data, depending on the questions asked.
Once the data is collected and analyzed, it can be used to examine patterns, make predictions about the future, and draw inferences.
For example, a survey of 100 consumers about where they plan to shop during the holidays might show that 45 of them plan to shop online, while the other 55 plan to shop in stores.
Questionnaires and surveys
Surveys and questionnaires are commonly used in quantitative research and qualitative research because they are both effective and relatively easy to create and distribute. With a wide array of simple-to-use tools, conducting surveys online is a quick and convenient research method.
These research types are useful for gathering in-depth feedback from users and customers, particularly for finding out how people feel about a certain product, service, or experience. For example, many e-commerce companies send post-purchase surveys to find out how a customer felt about the transaction — and if any areas could be improved.
Another common way to collect quantitative data is through a consumer survey, which retailers and other businesses can use to get customer feedback, understand intent, and predict shopper behavior.
Open-source online datasets
There are many public datasets online that are free to access and analyze. In some instances, rather than conducting original research through the methods mentioned above, researchers analyze and interpret this previously collected data in the way that suits their own research project. Examples of public datasets include:
Experiments
An experiment is another common method that usually involves a control group and an experimental group. The experiment is controlled and the conditions can be manipulated accordingly. You can examine any type of records involved if they pertain to the experiment, so the data is extensive.
Controlled experiments, A/B tests, blind experiments, and many others fall under this category.
Sampling
With large data pools, a survey of each individual person or data point may be infeasible. In this instance, sampling is used to conduct quantitative research. Sampling is the process of selecting a representative sample of data, which can save time and resources. There are two types of sampling: random sampling (also known as probability sampling) and non-random sampling (also known as non-probability sampling).
Probability sampling allows for the randomization of the sample selection, meaning that each sample has the same probability of being selected for survey as any other sample.
In non-random sampling, each sample unit does not have the same probability of being included in the sample. This type of sampling relies on factors other than random chance to select sample units, such as the researcher’s own subjective judgment. Non-random sampling is most commonly used in qualitative research.
Quantitative data analysis tools
Typically, data analysts and data scientists use a variety of special tools to gather and analyze quantitative data from different sources.
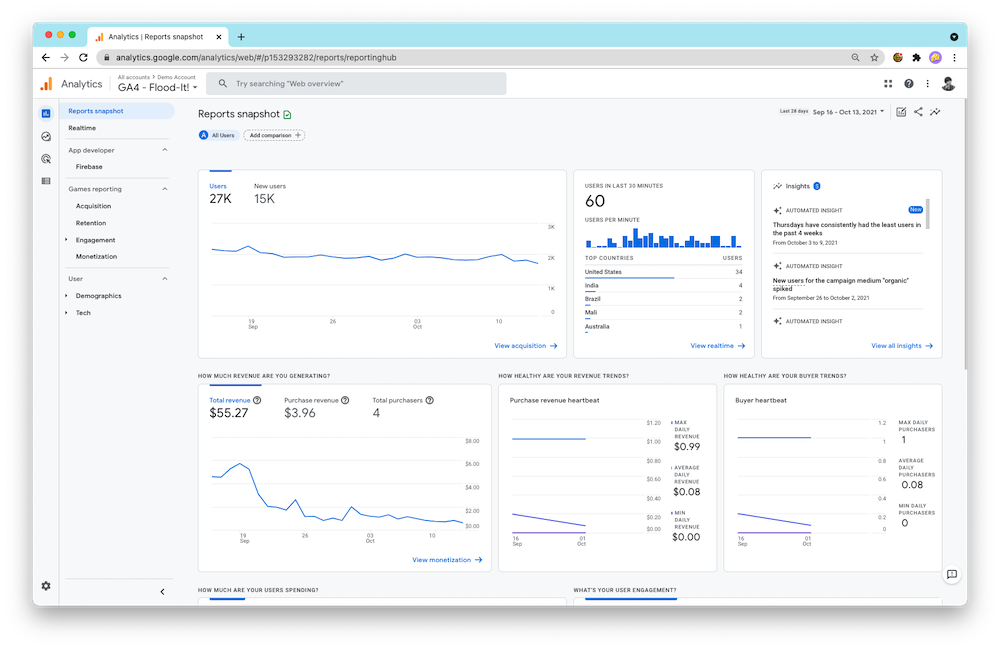
For example, many web analysts and marketing professionals use Google Analytics (pictured below) to gather data about their website’s traffic and performance. This tool can reveal how many visitors come to your site in a day or week, the length of an average session, where traffic comes from, and more. In this example, the goal of this quantitative analysis is to understand and optimize your site’s performance.
Google Analytics is just one example of the many quantitative analytics tools available for different research professionals.
Other quantitative data tools include…
Unlock business-critical data with Fullstory
A perfect digital customer experience is often the difference between company growth and failure. And the first step toward building that experience is quantifying who your customers are, what they want, and how to provide them what they need.
Access to product analytics is the most efficient and reliable way to collect valuable quantitative data about funnel analysis, customer journey maps, user segments, and more.
But creating a perfect digital experience means you need organized and digestible quantitative data—but also access to qualitative data. Understanding the why is just as important as the what itself.
Fullstory's behavioral data platform combines the quantitative insights of product analytics with picture-perfect session replay for complete context that helps you answer questions, understand issues, and uncover customer opportunities.
Start a free 14-day trial to see how Fullstory can help you combine your most invaluable quantitative and qualitative insights and eliminate blind spots.
