User retention metrics are essential for any successful user retention strategy. They help you understand—and quantify—how well your users are engaging with your product or service, and show whether your efforts to increase user engagement are working.
However, there’s more to user retention metrics than simply tracking a few key numbers. To get the most value out of your user retention metrics, you need to understand which metrics are the most important and know how to interpret them.
Below, we look at what user retention metrics are, some of the key metrics to track, and why tracking the right ones is critical to your success.
Key takeaways:
User retention metrics provide insight into how customers interact with a product or service.
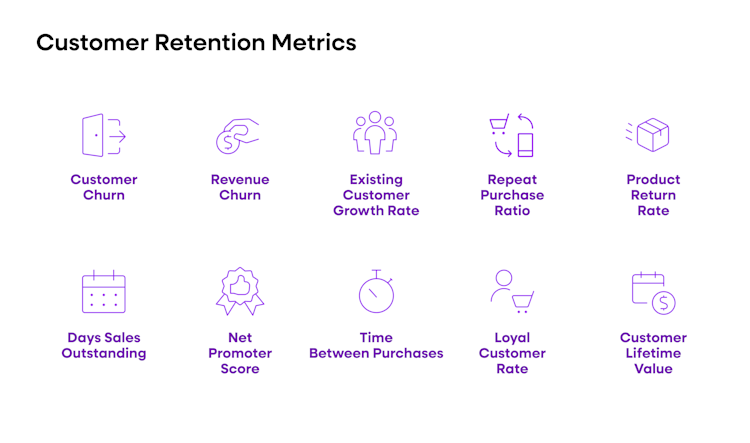
Important metrics include Net Promoter Score, Loyal Customer Rate, Repeat Purchase Ratio, and Engagement Rate by Channel, Segment, and Cohort.
Fullstory is a powerful tool that can help you track user behavior and maximize user retention.
What are user and customer retention metrics?
Customer retention metrics are any measurements of customer activity or engagement that help you understand how successful your user retention strategy is.
These metrics can include things like the number of clients who come back to use your product after a period of time, the average length of time it takes for those customers to return, and the percentage of users who become repeat buyers.
By tracking these numbers, you can get a better understanding of how your product is being used, which will help you make more informed decisions about user retention strategies.
Why is customer retention so important?
Customer retention is one of the most important metrics for any business. When customers remain loyal to your brand and keep coming back over time, it’s an indicator that they are satisfied with their experiences and are likely to continue being repeat customers.
This is a great sign that your company has managed to build long-term relationships with customers, which can lead to increased profitability and success.
A high customer retention rate also helps you save on marketing and advertising costs since cultivating loyalty is cheaper than acquiring new customers. Harvard Business Review estimates that customer acquisition costs (CAC) can be 5x to 25x more than retaining an existing customer.
Additionally, loyal customers tend to purchase more from your business over time. Current customers spend an average of 67% more compared to those who are still new to your brand.
Therefore, it’s essential that you track your customer retention rate in order to understand how successful your customer loyalty efforts are. It allows you to measure the effectiveness of your current strategies and adjust them as needed to ensure better long-term results.
Ultimately, this will help you build trust among customers, strengthen relationships, and increase revenue.
Customer retention vs. customer loyalty
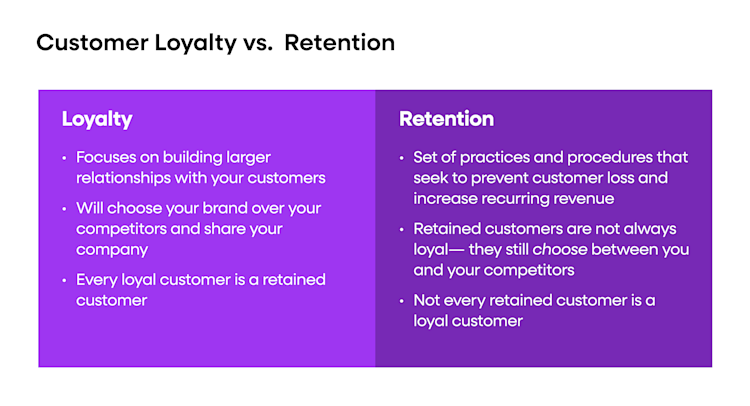
Customer retention and customer loyalty are two important concepts that are often used interchangeably but have distinct meanings. Customer retention is the measure of how many customers remain active with a business over time.
This metric focuses on the percentage of your customer base that continues to purchase products or services from a company. Customer loyalty, however, looks at the emotional connection and affinity between customers and businesses.
Conversely, this metric measures how likely customers are to promote a company’s product or service to other people—or even how likely they are to come back to a company as repeat customers.
In addition, loyal customers are more likely to spread positive word of mouth about a company’s product or service, which leads to more referrals, new customers, and ultimately more sales.
Unlike customer retention, customer loyalty is not limited to just looking at the percentage of customers that return for additional purchases. Loyalty metrics, like Net Promoter Score (NPS) and Customer Satisfaction Score (CSAT), can provide helpful insights into customer feedback and how likely they are to recommend a business to others.
Additionally, loyalty metrics can help businesses better understand the overall happiness of their customers so that they can make improvements where necessary.
By understanding both customer retention and customer loyalty, companies can gain valuable insights into the health of their customer base and website well-being, and develop strategies for improving both.
Most important user retention rates
Retention rates are a key indicator of user engagement. While there are a variety of metrics that can be used to measure user retention, some are more important than others.
Here are the three most essential user retention rates you should track:
1. User/customer retention rate
This metric is the most fundamental and straightforward of user retention rates. It measures the percentage of customers who return to your product or service over a given time period.
Moreover, customer retention rates can be used to track long-term user engagement and loyalty. With this information, you can better determine if your current strategy is effective or if you need to make changes.
How to calculate customer retention
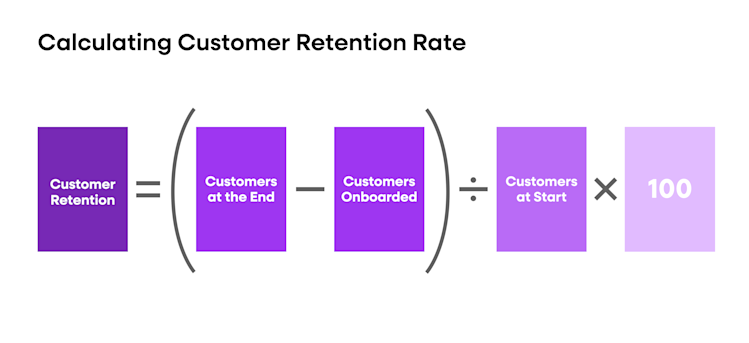
In order to calculate your customer retention, you first need to collect some basic data. Begin by adding up the total number of customers at the beginning of a given period.
Next, add up how many customers were onboarded during that period. Finally, add up how many customers were at the end of that period.
Then, subtract onboarded customers from those at the end and divide the total number of returning customers by the total customer number at the start of that period and multiply by 100 to get a percentage. This percentage is your customer retention rate.
Customer retention = (customers at end - customers onboarded) / (customers at start) * 100
2. Customer Churn
Whereas retention rate measures customers who are staying with your brand, churn rate measures the percentage of customers who are lost over a given time period.
This metric can be used to better understand why customers may not be sticking with your product or service and can help identify areas that need improvement.
It’s important to track this metric over time, as it will help you determine user loyalty and understand when customers may be at risk of leaving.
Calculating customer churn
Customer churn can be calculated by dividing the number of lost customers at the beginning of a period and dividing that by the total customer number at the start of that same period. Multiply the number you get by 100 to calculate your customer churn.
This calculation will provide you with an idea of how many customers have left your product or service during a given time frame.
It’s important to track customer churn over time, as this will help you identify any potential changes in user engagement or areas of improvement.
Churn rate formula
Customer churn = (customers lost / customers retained) * 100
Example of customer churn
Let’s say you are a subscription-based business, and you start off with 100 subscribers in June 2023. By October 2023, you’ve lost five subscribers. This means you have a 5% customer churn rate for that period.
To calculate this, divide the number of customers who left (five) by the total customers at the beginning of the period (100) and multiply it by 100. You can then see how your retention rate (the percentage of customers who remain after a certain time frame) has changed over time.
3. Revenue churn rate
The third most important metric is the revenue churn rate. This metric measures customer lifetime value and helps you understand how much money your business is making from each customer over time.
Understanding the relationship between customer spending and time with your product can help inform decisions about marketing campaigns or changes in product pricing that could increase long-term customer loyalty and overall profitability.
Keep in mind that a number of factors can influence revenue churn rate, including:
Customer order cancellations
Canceled or downgraded customer subscriptions
Leaving your business altogether
Customer satisfaction
Pricing changes
Competitive landscape
It’s important to measure this metric periodically over time to get an accurate understanding of your business status and where you stand with your revenue churn rate.
Calculating revenue churn rate
Revenue churn rate is calculated by taking the total amount of revenue lost over a specific period of time (usually one month) and dividing it by the average monthly recurring revenue during that same period.
For example, if your business had an average monthly recurring revenue (MRR) of $1000 in January and you lost $300 in revenue due to customer churn, your revenue churn rate would be 30%: ($300 divided by $1000 = 0.3 or 30%)
Once you calculate the rate, track it over time to identify trends and areas of improvement in order to boost customer loyalty and maximize profits.
It’s important to calculate your revenue churn rate at the end or the beginning of the month so that you can quickly identify changes and react accordingly.
4. Existing customer revenue growth rate
Existing customer revenue growth rate is an important user retention metric that measures the year-over-year increase in your existing customer base’s spending.
This metric helps to indicate whether or not you’re successfully retaining customers and increasing engagement, which can help guide future marketing campaigns.
Calculating existing customer revenue growth rate
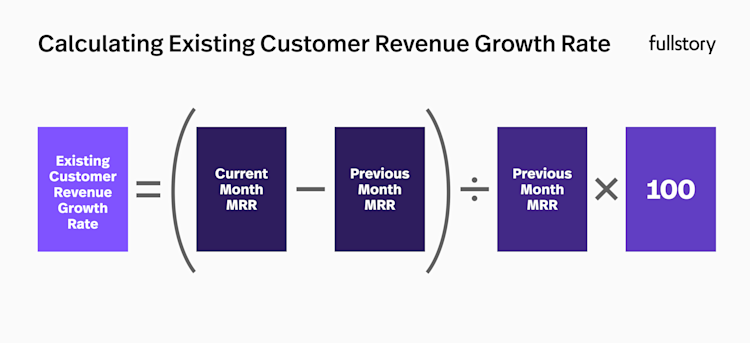
In order to successfully calculate your existing customer revenue growth rate, you’ll need to know the monthly recurring revenue (MRR) amount associated with each of your customers.
Once you have this data, you can plug it into the following formula:
Existing Customer Revenue Growth Rate = (current month MRR - previous month MRR) / previous month MRR * 100
This metric helps to show how effectively you’ve been retaining customers and increasing their spending. It also provides an easy-to-understand number that can be used to measure your success over time.
5. Daily, weekly, and monthly active users (DAU, WAU, MAU)
These are the most crucial user retention metrics for tracking engagement, as they provide an overall measure of how many users are returning to your product or service over a certain period of time and can help identify areas of growth.
DAU/WAU/MAU can also be broken down further into cohorts, which give more detailed insights like the average number of days between visits, the most active days of the week for users, and differences between user groups.
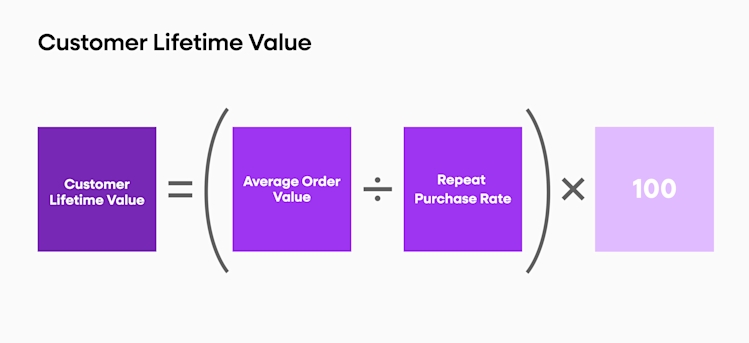
6. Customer lifetime value (CLV)
Understanding the value of individual customers over their lifetime is key to optimizing user retention and improving your product or service. CLV helps you understand how much money a customer brings in over time and allows you to identify which users are taking up more resources and which ones are driving higher revenue.
As a business, it’s best to strive for a CLV that either improves or stays the same—a CLV that is decreasing is a sign of user churn.
Calculating customer lifetime value
Calculating CLV is relatively straightforward and can be done by taking the average value of a customer over their lifetime (total revenue/number of customers) and multiplying it by the average lifespan of customers.
For example, if your gross annual sales are $12 million and you have 10,000 unique clients for the year, then your CLV would be calculated as follows: ($12 million/10,000) x (average customer lifespan) = Customer Lifetime Value
By tracking changes in CLV over time, you can better measure the long-term impact of user retention strategies on your business.
7. Product return rate
Product return rate measures the percentage of products that are returned or refunded after a purchase. It’s important to note that this metric only applies to businesses that sell physical products.
If your business sells products, it’s best to aim for a product return rate of 0% or as close to 0% as possible, as this indicates that customers are satisfied with their purchases and unlikely to return them.
Calculating product return rate
First, take the total number of products sold in a specific time frame. Then divide the number of returned or refunded products from that same time frame. Finally, multiply the result by 100 to get your product return rate.
8. Net Promoter Score
Net Promoter Score, or NPS, measures customer loyalty and ranges from -100 to 100. It’s important to be aware that NPS can’t guarantee customer retention and growth, but it does indicate the likelihood of your customers recommending you to others.
Higher scores mean higher satisfaction with the product or service, so a high NPS is an important metric for maintaining user loyalty. A good NPS score will always lead to higher customer retention.
Calculating Net Promoter Score
NPS is calculated by asking customers to rate their likelihood of recommending products or services from 0 to 10. Customers who give 9s and 10s are considered Promoters, 7s and 8s Neutral, and 6s and below Detractors.
The NPS score is then determined by subtracting the percentage of Detractors from the percentage of Promoters.
9. Loyal customer rate
This metric measures how many customers keep coming back to your product or service. It’s important to track this to see if customers are returning and help you understand why they keep coming back.
You can determine how many customers are loyal to your product by looking at the number of clients who have purchased from you more than once in a given time period.
Calculating loyal customer rate
To calculate your loyal customer rate, you first need to determine which customers have bought from your more than four times in a single year. Next, divide that number by the total number of total customers in the same period. This will give you your loyal customer rate.
10. Repeat purchase rate
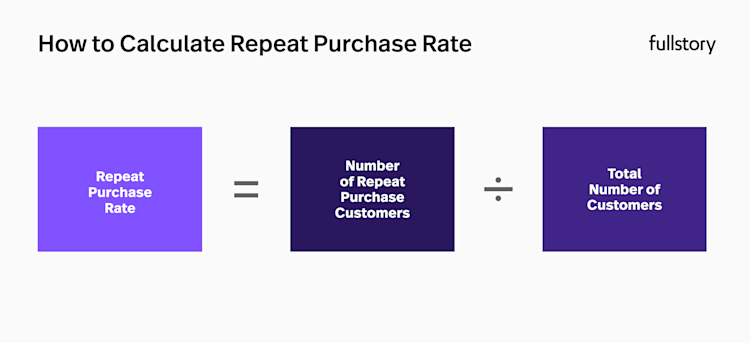
The Repeat Purchase Rate is a measure of the percentage of customers that make repeat purchases. It’s a great metric for understanding how customers are coming back to purchase again and whether or not they are overall satisfied with their first purchase.
A high RPR indicates that there is an effective customer retention strategy in place and that users are satisfied with their initial purchase. A low RPR suggests that there is a need for improvement in how customers are retained and encouraged to return.
Calculating repeat purchase rate
The Repeat Purchase Ratio is calculated by taking the number of clients who have made more than one purchase and dividing it by the total customer number. This ratio can then be multiplied by 100 to convert it into percentage form.
Engagement rate by channel, segment, and cohort
Analyzing the engagement rate by channel and segment will help you understand which channels, segments, and cohorts are more successful in terms of retention. This analysis is especially useful when making decisions regarding product development or marketing campaigns.
Use Fullstory to maximize user retention
Fullstory is a powerful digital experience analytics tool that allows you to track user behavior and interactions on your website or app. It provides valuable insights into how users are using your website, which pages they’re visiting, where they’re getting stuck, and more.
It’s also one of the single best tools to help CX teams understand what their customers want, need, and how to retain them.

