In my previous post, we addressed the question, “What should I fix on my application first?” We also discussed using Conversions as a tool to find the most impactful friction points affecting your users. However, there are most likely additional signals, and in this post, we will discuss the best way to find them.
The general approach is to take a given signal and then show the top areas where it appears using Metrics. Then, we start with the most prominent areas and work our way down. We will go through each of the top signals I use to find trouble spots in an application. This approach has proven itself with many different customers.
Network Errors
The first signal I investigate is Network Errors. Modern applications make many network calls to obtain or process information from the user’s interactions, such as loading the user's saved payment methods or processing a checkout. When there is a problem making these network calls, friction often follows.
Our metric will start with the following definition, counting the Events where a Network error URL occurs.
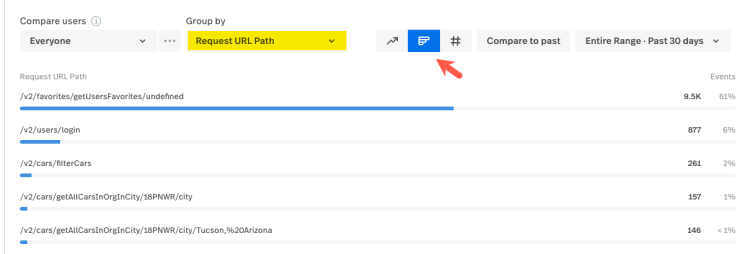
To find the top Network Calls causing the problem, we can group by Request URL Path and show a dimensionality view of the data.
This will show us the top Network calls that had errors during the specified time range. We can then watch sessions for the individual Network calls (Filtering by dimension in the Metric card) and verify if the call is causing the user any friction, as some Network errors are benign from the user’s perspective.
I start with the most prominent ones and work my way down. It is sometimes helpful to investigate individual calls further, which you can do by specifying the specific network error URL.
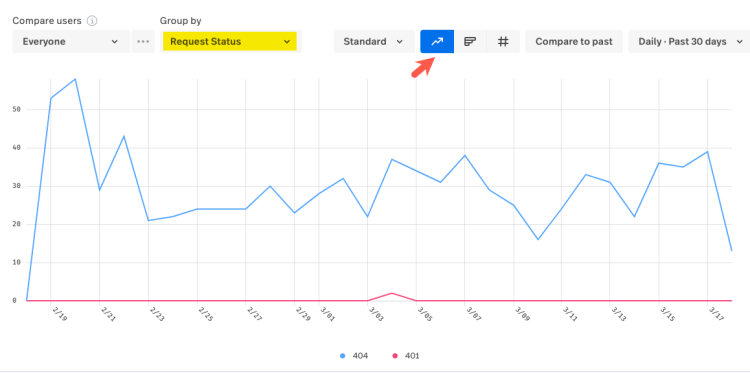
You can then group by Request Status and view it as a dimensionality or trend to analyze deeper. This can be helpful to determine if it is a constant problem or related to specific outages.
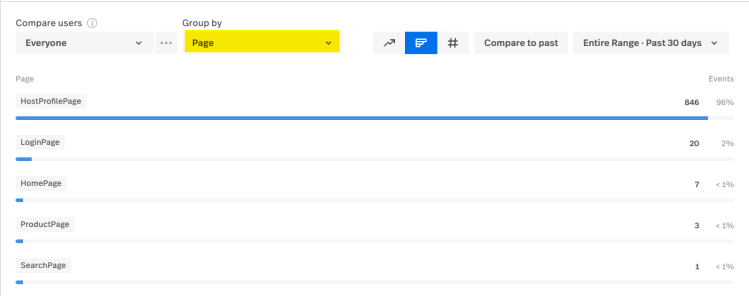
In addition to grouping by Request URL, I also recommend grouping by Page or URL Path (depending on your individual setup) This will be a grouping we do for all of the signals, as it can help with analyzing if any Pages are more problematic than other Pages.
Dead Clicks
The next signal I would focus on is Dead Clicks. Dead Clicks are when a user clicks something, and nothing detectable happens within a few seconds. This can be due to a bug in the application or the application being very slow to react to the click. The Metric starts with counting Events of dead-clicking anything.
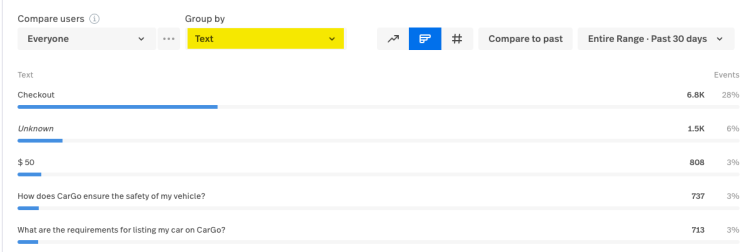
If you have exact Element definitions, you can then group by Element / CSS Selector. If you do not have precise Element definitions, it is best to group by Text.
If you see Unknown as a result, that means it is either an Image or the Text is masked. You can then use the above strategies (diving into individual elements, showing metric trends) to watch sessions for the individual Elements or Text, starting from the most prominent and working your way down.
As with Network Errors, it is helpful to group by Page or URL Path to see if the problem is more prominent on given Pages.
Rage Clicks
A very clear signal of frustration is the Rage Click. A Rage Click is when a user clicks or touches an element multiple times quickly. The grouping and analysis of Rage Clicks are identical to that described above by Dead Clicks.
Thrashed Cursor
If you have ever been frustrated or confused by a site, you might have moved your cursor back and forth erratically. If so, you have just demonstrated what a Thrashed Cursor is. This is the next signal we are going to look at. The only grouping we'll use for Thrashed Cursor is Page or URL Path as it happens in the context for a given Page. One thing to note about a Thrashed Cursor is that this signal is for the web only.
Refreshed URL
When you are on a page that just isn’t working the way you would expect, a common behavior can be to hit the reload or refresh button of your browser to see if that fixes the site. We can use this behavior as a signal that the user is seeing something they didn’t expect. The Refreshed URL signal is our next signal. Just like with Thrashed Cursor above, it is only available for Web and we will only group it by Page or URL Path.
The five signals described above, Network Errors, Dead Clicks, Rage Clicks, Thrashed Cursor, and Refreshed URL, are considered high-quality signals likely to point you to user frustration. We will describe two more signals that are less likely to lead to user frustration but that can be worthwhile to investigate, especially for engineering or development teams. Both signals require Console Data Capture to be enabled, which can be viewed in the Console view of Dev Tools.
Uncaught Exception
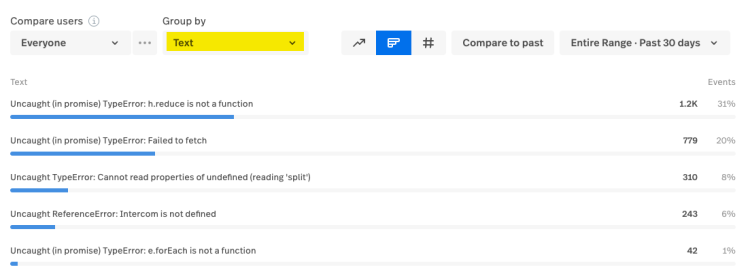
An Uncaught Exception is when an error is thrown but not properly handled by code. It can be a sign of a bug, often an edge case that was not properly managed and/or tested. Unfortunately, it can also be benign and just represent code that is poorly handling errors. This is what makes investigating Uncaught Exceptions (and the next signal, Console Errors) very difficult. A good starting point is to watch Session Replays of the top Uncaught Exceptions and see if they cause any user frustration or UI feedback. Even if you determine it is not causing any issues for the users, it still may be worthwhile to pass along the top Uncaught Exceptions to your development/engineering teams for investigation and cleanup. Uncaught exceptions are best grouped by Text and page or URL path. At the time of this writing, uncaught exceptions are available for Web and Android Native Mobile.
Console Error
A very close relative of the Uncaught Exception is the Console Error. A Console Error happens when the application outputs a logging message at the error level. This typically means that the application is aware an error occurred but wants to log it for debugging purposes. Console Errors are, unfortunately, very numerous in modern applications, making this a low-quality signal for finding user problems. However, it is worth investigating the top few Console Errors to verify that they are not causing problems and passing these along to your development teams for further verification. As with Uncaught Exceptions, Console Errors are best grouped by Text, Page, or URL Path. Console Errors are available for both Web and Native Mobile, but some setup may be required for Native Mobile for IOS and Android.
Bringing it all together
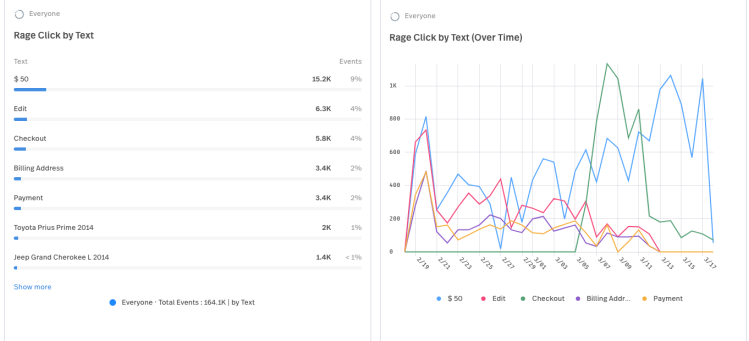
You can see that grouping these seven signals in Metric Dimensionality cards can help you see where your top potential friction points are for your users. The next step is to bring all of these cards together in a Dashboard that you can revisit as needed. Some customers prefer a Dashboard per signal, and others prefer to put all of them on one Dashboard. Whichever path you choose, I recommend showing both a Dimensionality and Trend view of each card side by side. For example, here is Rage Click by Text, both rolled up and trended over time:
This gives an excellent view that lets you see the top Rage Clicked Text by Text over the time period, but also the trends so you can spot if a new Rage Click has appeared. In the example above, we can see that Checkout is a new Rage Click that appeared on 3/6, it spiked for a few days and then has come back down to a baseline.
Here is the full Dashboard card list, with each bullet having a side by side of Dimensionality and Trend:
Network Errors
By Request URL
By Page or URL Path
Dead Click
By Element or Text
By Page or URL Path
Rage Click
By Element or Text
By Page or URL Path
Thrashed Cursor
By Page or URL Path
Refreshed URL
By Page or URL Path
Uncaught Exception
By Text
By Page or URL Path
Console Error
By Text
By Page or URL Path


