Understanding data is a lot like understanding the complexities of life. Data can be complicated, and the shortcomings and victories aren’t always apparent—they’re buried in the details.
Data—specifically quantitative data—is no different. In order to analyze and interpret this data type, you’ll need to understand the nuances, details, and other factors.
We’ll cover the basics of quantitative data, quantitative data examples, its different types, use cases, and how to collect it for yourself.
What is quantitative data?
At its simplest level, quantitative data is information that can be quantified. It’s data that can be counted or measured, and given a numerical value.
Quantitative variables can tell you "how much," "how many," or "how often."
The different categories of quantitative data include:
Measurements, counts, and calculations: for example, the attendees of a webinar.
Sensors: a photosensor detecting the presence of light.
Quantification of qualitative data: how a categorical group of people felt about a quiz.
Projections: expected revenue for Q4
Knowing what type of quantitative data — also called numerical data — you’re working with helps teams apply the correct type of statistical analysis.
Since quantitative data is statistically analyzed and mathematical in nature, research can be extremely detailed. And due to its numerical nature, there��’s less potential for bias in the data. The results obtained are objective in nature, so they are extremely accurate.
Quantitative Data 101: What is quantitative data?
Take a deeper dive into what quantitative data is, how it works, how to analyze it, collect it, use it, and more.
What are the different types of quantitative data?
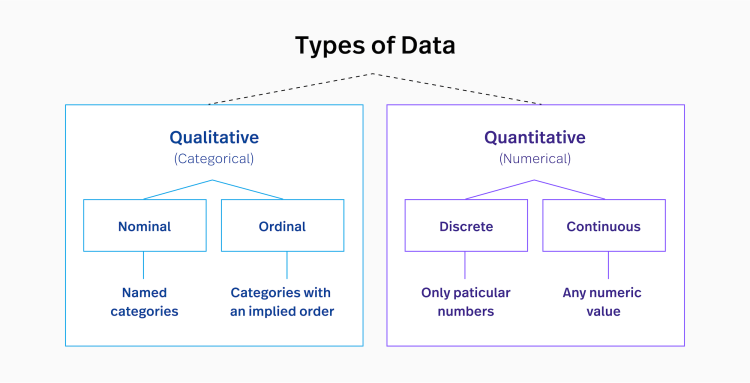
There are three types of quantitative data, and each carries valuable information: discrete, continuous, and interval (as compared to ratio) data.
Discrete data
Discrete data is information that can only take certain numerical values. This type of data is often represented using tally charts, bar graphs, or pie charts.
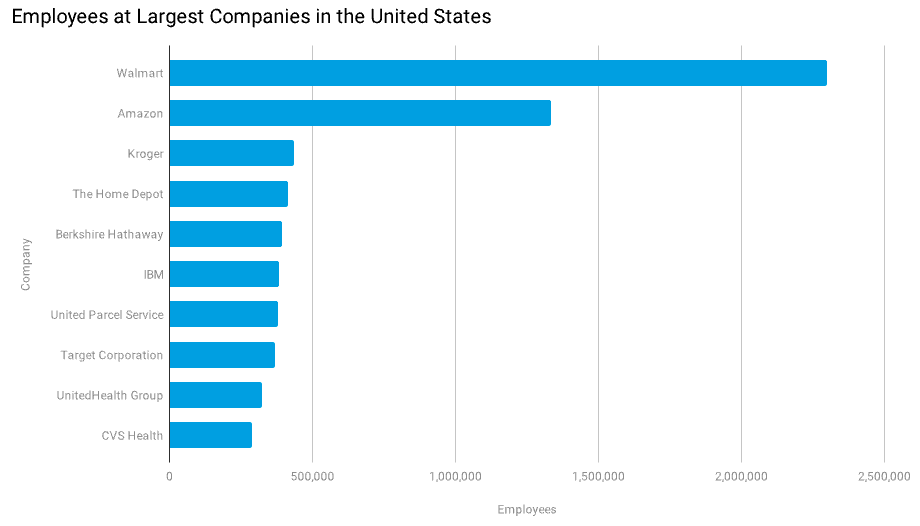
Discrete data is information that is collected and can be counted. This type of data only has a certain number of values. Typically, it involves integers—whole numbers, rather than fractions. For instance, the number of students in your class is discrete data to be counted as a whole (for example, you can’t have 22.5 students).
Examples of discrete data include:
The number of students in a class
The how many cars driving above the speed limit on a freeway
Field goals landed in a football game
Continuous data
Continuous data is data that can take any value and can be infinitely broken down into smaller parts. It differs from discrete data in that it can change its value.
Continuous data can also fluctuate over time. Some examples of continuous data are:
My brother is 114 inches tall
The elephant weighs 3 tons
The temperature of the sun is 10,000 Fahrenheit
As you can see, these can change at any given time. Additionally, continuous data can be classified as interval data or ratio data.
Interval vs. ratio data
The difference between interval and ratio data derives from their ability to fall below zero.
Interval scales can represent values below zero. Ratio variables, on the other hand, never fall below zero. Ratio data has all the characteristics of an interval scale, but it can also calculate ratios—meaning you can leverage numbers on a scale against zero. The ratio scale has an absolute zero or character of origin.
The difference between interval vs ratio data sets:
Interval: A certain temperature can fall below 0 degrees.
Ratio: Your height and weight cannot equal zero or be below zero.
How is quantitative data collected?
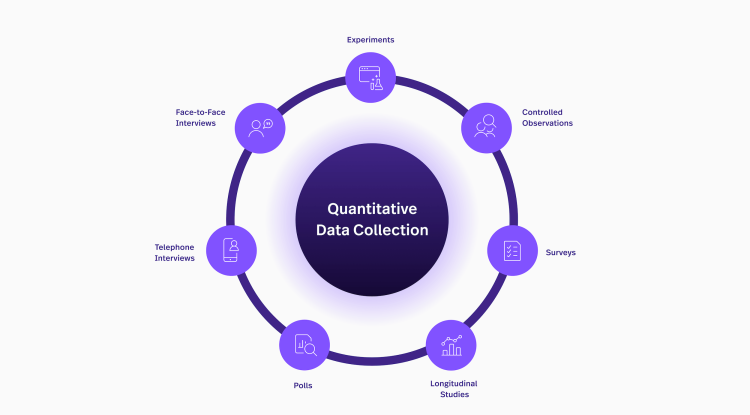
There are many methods for collecting data: analytic tools, sampling, questionnaires, and open-source datasets, among others.
Analytics tools
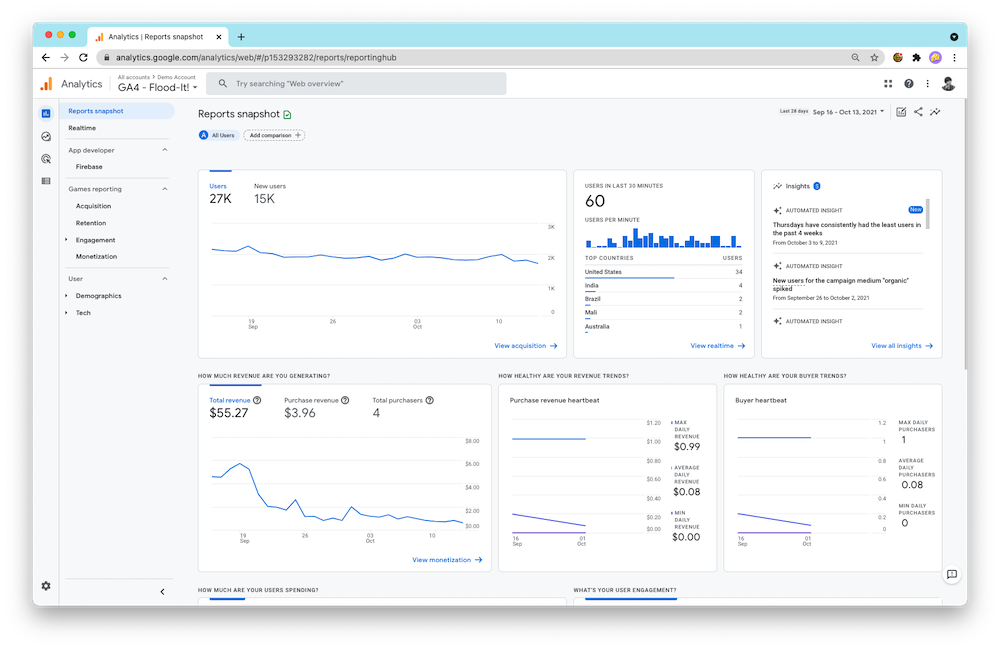
Google Analytics is a popular tool used by data analysts and data scientists to gather quantitative data from various sources.
Alongside Google Analytics, there are other tools that can be integrated with internal databases, data lakes, cloud storage, business apps, social media, and IoT devices.
Examples of analytics tools to start with:
Google Cloud
Cloud computing services by Google. Store your data in Google Cloud in any file or format.
AWS
Cloud services by Amazon that provide services in the form of building blocks that can be used to create and deploy any type of application in the cloud.
Oracle
The integrated cloud applications and platform by Oracle that provides a relational database management system. Oracle supports any kind of data model and has different product editions depending on your needs.
Fullstory
Fullstory is a behavioral data platform that combines rich analytics, robust session detail, and collaboration tools to help you answer questions, understand issues, and uncover opportunities—and then put that knowledge to work.
Sampling
Sampling is when, instead of analyzing an entire dataset, you select a sample or "section" of the data to evaluate. Each large sample can then be broken down by a data set.
There are two types of sampling:
Random probability sampling: where each unit within the overall dataset has the same chance of being selected.
Non-probability sampling: where the sample is actively selected by the researcher or analyst—not at random.
Quantitative data analysis could use Python (a common programming language) and various algorithms to extract samples from large data sets. The larger the data set, the more they can break down different sampling types.
Questionnaires and surveys
Questionnaires and surveys are another way to collect quantitative data—with feedback.
A questionnaire is a term used to describe the set of questions you're asking an individual. A questionnaire is actually a part of a survey. The purpose of a questionnaire is to gather data from a target audience. It will include open-ended questions, closed-ended questions, or a combination of both.
A survey is the process of collecting, analyzing, and interpreting data from participants and respondents. A survey goes much deeper than a questionnaire and often involves more than one form of data collection. The purpose of a survey is to find out information about a selected group of people.
For example, businesses use surveys to find out how specific customers behave. These survey questions can help transform business objectives, reduce friction and decrease churn. (Or you could use a best-in-class Digital Experience Intelligence solution to suss out any problems with Session Replay.)
Open-source datasets online
A dataset is a collection of data that corresponds with several tables (usually in tabs). In most datasets, the columns represent specific variables and the rows represent records within the dataset—with the intent of finding a correlation.
The internet has a wide range of datasets, such as those from government, business, finance, science, manufacturing, entertainment, and more.
There are many sources for finding the data:
Google Dataset Search: Google Dataset Search is Google’s standard search engine for data only.
Data.gov: This is all data from the US Government on various industries, which is publicly available.
Datahub.io: Here you’ll find economic or business datasets like entertainment, stock market data, inflation, financial logistics, and more.
It is up to the user which dataset to use and there are many descriptive statistics to consider. Most of the online datasets are free to visit and find information.
What are quantitative data examples?
Since quantitative data is defined as the value of data in the form of counts or numbers, each data set has a numerical value associated with it.
Quantitative data examples in research
If you were using quantitative data in your analysis, you’ll be doing a lot of counting and measuring. Some basic examples of quantitative data include:
Weight in pounds
Length in inches
Distance in miles
Number of days in a year
A heatmap of a web page
These research examples make up the core foundation of quantitative data and are widely used in statistical analysis.
Quantitative data use cases in research
The value of analyzing quantitative data is considered a core part of any descriptive statistical analysis. Here are a few quantitative data use cases in research.
Research
Researchers project future data using algorithms and mathematical analysis tools. Weather patterns, supply and demand, and various scientific studies all rely on quantitative research.
Research in healthcare is highly quantified in its data—with all things being measured and counted for the next cure or vaccine.
Government
Governments carry out a census to acquire and record information about the members of a given population. They also rely on citywide data to predict the building of new infrastructure, roads, and businesses.
Business
Businesses use quantitative data of the annual income of a person or household to determine their purchasing power.
Online businesses use data to determine the number of website visits they get daily, the number of product downloads on the app store, the number of users, etc.
And, businesses use customer satisfaction surveys data to tell you on a scale of 1-10 how they feel about a product or service.
Quantitative data and you
When it comes to data, we know how important it is, in fact, it’s all we do at Fullstory. With a Digital Experience Intelligence platform, you can use quantitative data to become a better product, make happier customers and proactively enhance any experience.
Combine quantitative and qualitative data for comprehensive understanding to perfect your digital experience. These different types of data can truly help the customer experience.
Looking at pure data analytics can be insightful, but requires that you know what you want to measure, what questions you want to answer, and the path you think users will take.
Reviewing data session details provides invaluable context, but can be hard to see the big picture.
By combining the quantitative and qualitative in real time, Fullstory eliminates data blind spots.
Unlock business-critical data with Fullstory
A perfect digital customer experience is often the difference between company growth and failure. And the first step toward building that experience is quantifying who your customers are, what they want, and how to provide them what they need.
Access to product analytics is the most efficient and reliable way to collect valuable quantitative data about funnel analysis, customer journey maps, user segments, and more.
But creating a perfect digital experience means you need organized and digestible quantitative data—but also access to qualitative data. Understanding the why is just as important as the what itself.
Fullstory's DXI platform combines the quantitative insights of product analytics with picture-perfect session replay for complete context that helps you answer questions, understand issues, and uncover customer opportunities.
Start a free 14-day trial to see how Fullstory can help you combine your most invaluable quantitative and qualitative insights and eliminate blind spots.

