Data analysis is at the core of any solid business strategy—however, it can get pretty complex.
As you probably know, data can be broken down into two main categories: quantitative data and qualitative data. Though very different, both types are highly valuable in understanding the digital customer experience.
Today, we’re focusing on the importance of qualitative data—the different types, examples, and why it’s important to your bottom line.
The definition of qualitative data
Qualitative data, also called categorical data, is used to categorize something in a descriptive, expressive way, rather than through numerical values. Simply put, it’s information about an object or subject that you can see or feel.
Generally, qualitative analysis is used by market researchers and statisticians to understand behaviors. For business, it’s commonly used by data analysts to understand and interpret user behavior.
You can turn to qualitative data to answer the "why" or "how" behind an action. It’s often used to investigate open-ended studies, allowing participants (or customers) to show their true feelings and actions without guidance.
Qualitative data includes traits such as how a customer feels about a product or service and what they are motivated by. It’s excellent in understanding the motivations behind customer experiences.
There are many ways to gather qualitative data, including:
Research and observation
Interviews
Surveys or questionnaires
Focus groups, online forums, or communities
Case studies
These types of qualitative research methods are often expressed using studies, pie charts, or graphs.
The importance of qualitative data
At a high level, qualitative data analysis provides data analysts a way to identify trends in the world around them.
For online businesses, qualitative data can be used to identify the particular frequency of traits or characteristics in customers, users, or website visitors.
Qualitative data can also help businesses understand their consumers’ language and address problems effectively and efficiently, which is priceless when you’re trying to scale and grow a company.
Qualitative (categorical) vs. quantitative data
Before we get into types and examples, here’s a quick breakdown of the differences between qualitative and quantitative data.
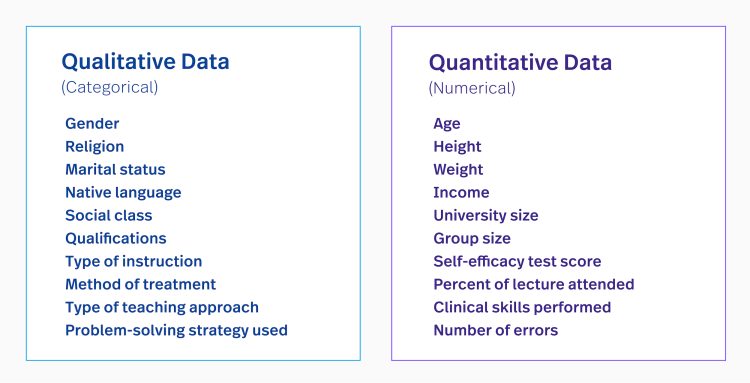
Qualitative data is observational and descriptive, while quantitative data is numerical and measurable. Data analysts often use qualitative and quantitative data together when conducting studies or analyses.
When it comes to data research, you’ll need different collection, hypotheses, and analysis methods, so it’s important to understand the key differences between quantitative and qualitative data:
Quantitative data
Numbers-based, countable, or measurable
Tells us how many, how much, or how often in calculations
Analyzed using statistical analysis
Qualitative data
Interpretation-based, descriptive, and relating to language
Understand why, how, or what happened behind certain behaviors
Analyzed by grouping the data into categories and themes
Types of qualitative data
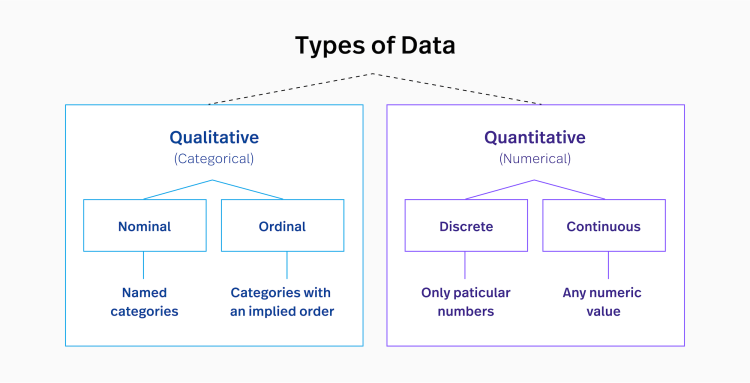
As we narrow down the importance of qualitative data, you should understand that there are different types. Data analysts often categorize qualitative data into three types:
1. Binary data
Binary data is represented or displayed in the binary numeral system and is numerically represented by a combination of zeros and ones—much like coding on a computer. In fact, binary data is the only category of data that can be directly understood and executed by a computer.
Researchers use binary data to create statistical models that predict how often the study subject is likely to be positive or negative, up or down, right or wrong.
2. Nominal data
Nominal data, also called “named” or “labeled data,” or a “nominal scale,” is any type of data used to label something without giving it a numerical value.
Data analysts use nominal data to determine statistically significant differences between sets of qualitative data. Additionally, you might use nominal data to create multiple-choice survey responses or to profile participants.
3. Ordinal data
Ordinal data is qualitative data categorized in a particular order or on a ranging scale. When researchers use ordinal data, the order of the qualitative information matters more than the difference between each category.
For example, questionnaire responses on a scale from satisfied to unsatisfied are considered ordinal data results. Data analysts might use ordinal data when creating charts, while researchers might use it to classify groups such as age, gender, or class.
Qualitative data examples
Qualitative data is all around you. We’re going to cover how this type of data might appear in descriptions, research, work, and statistics.
Qualitative data in descriptions
Describing data points can create more context in your analysis. Here are some basic examples of qualitative data in a descriptive style:
The woman has light brown hair and bright blue eyes.
The office was dark and cold with light tan wallpaper.
The purple flowers smelled like lilac and lavender.
The plump, white dog had cute whiskers.
The tall businessman wore a gray striped suit.
The tan leather couch was soft and comfortable.
Qualitative data in research
Qualitative data research methods allow analysts to describe and explain their subjects and use that information to create theories and models. This can be helpful to understand motivations and actions.
Examples of qualitative data collection in research include open-ended and close-ended questions like:
What state do you live in?
What is your most recent degree: bachelor’s, master’s, or Ph.D.?
How do you rank against your competition?
Which digital intelligence platform do you use the most: Fullstory, Google Analytics, or HotJar?
How do you rate the restaurant’s customer service: not good, good, great, or excellent?
Qualitative data at work
Professionals in many industries use qualitative observations in their work and research. Examples of this type of data in the workforce include:
A professor gives a student feedback on their math skills. "Your calculations are concise, and you understand the core concepts."
A psychiatrist observes and analyzes a patient’s behavior. "The woman was angry and disinterested in her husband."
A marketer collects feedback through surveys and customer interviews. "The customer said the onboarding experience was top notch.”
A doctor evaluates the lifestyle and behavior of patients to determine health risks. "Most patients have elevated blood pressure because of high levels of stress."
A lab student transcribes what happens during an experiment: "The solution turned pink when we added salt."
Qualitative data in statistics
Qualitative data can provide companies with important statistics about customers, groups of users, and products. Here are some examples of qualitative data set collections for statistical purposes:
The origin, gender, and location of citizens so a state legislature can categorize the population in a certain county.
The name, title, and profession of people attending a webinar to help target the right content.
The age, weight, and height of a group of children to determine clothing size charts.
Pros and cons of qualitative data
Qualitative data is a detailed, deep understanding of a topic through observing and interviewing a sample of people. There are both benefits and drawbacks to this type of data.
Pros of qualitative data
Qualitative research is affordable and requires a small sample size.
Qualitative data provides a predictive element and provides specific insight into development.
Qualitative research focuses on the details of personal choice and uses these individual choices as workable data.
Qualitative research works to remove bias from its collected data by using an open-ended process.
Qualitative data research provides useful content in any data analysis.
Cons of qualitative data
Qualitative data can be time-consuming to collect and can be difficult to scale out to a larger population.
Qualitative research creates subjective information points.
Qualitative research can involve significant levels of repetition and is often difficult to replicate.
Qualitative research relies on the knowledge of the researchers.
Qualitative research does not offer statistical analysis, for that, you have to turn to quantitative data.
A qualitative data collection tool
By collecting qualitative data using a Digital Experience Intelligence (DXI) solution like Fullstory, data analysts have access to customer intelligence and robust research capabilities. Data analysis is made easy with an efficient data collection tool that replays real-time sessions.
DXI combines qualitative and qualitative data to analyze the customer experience at different points along their omnichannel journey, and use robust insights to continuously improve the digital customer experience.


