Everything that’s done digitally—from surfing the web to conducting a transaction—creates a data trail. And data analysts are constantly exploring and examining that trail, trying to find out ways to use data to make better decisions.
Different types of data define more and more of our interactions online—one of the most common and well-known being qualitative data or data that can be expressed in descriptions and feelings.
This guide takes a deep look at what qualitative data is, what it can be used for, how it’s collected, and how it’s important to you.
Key takeaways:
Qualitative data gives insights into people's thoughts and feelings through detailed descriptions from interviews, observations, and visual materials.
The three main types of qualitative data are binary, nominal, and ordinal.
There are many different types of qualitative data, like data in research, work, and statistics.
Both qualitative and quantitative research are conducted through surveys and interviews, among other methods.
What is qualitative data?
Qualitative data is descriptive information that captures observable qualities and characteristics not quantifiable by numbers. It is collected from interviews, focus groups, observations, and documents offering insights into experiences, perceptions, and behaviors.
Qualitative data analysis cannot be counted or measured because it describes the data. It refers to the words or labels used to describe certain characteristics or traits.
This type of data answers the "why" or "how" behind the analysis. It’s often used to conduct open-ended studies, allowing those partaking to show their true feelings and actions without direction.
Think of qualitative data as the type of data you’d get if you were to ask someone why they did something—what was their reasoning?
What is qualitative research?
Qualitative research not only helps to collect data, it also gives the researcher a chance to understand the trends and meanings of natural actions.
This type of data research focuses on the qualities of users—the actions behind the numbers. Qualitative research is the descriptive and subjective research that helps bring context to quantitative data.
It’s flexible and iterative. For example:
The music had a light tone that filled the kitchen.
Every blue button had white lettering, while the red buttons had yellow.
The little girl had red hair with a white hat.
Importance of qualitative data
Qualitative data is important in determining the frequency of traits or characteristics.
Understanding your data can help you understand your customers, users, or visitors better. And, when you understand your audience better, you can make them happier. First-party data, which is collected directly from your own audience, is especially valuable as it provides the most accurate and relevant insights for your specific needs.
Qualitative data helps the market researcher answer questions like what issues or problems they are facing, what motivates them, and what improvements can be made.
Examples of qualitative data
You’ve most likely used qualitative data today. This type of data is found in your everyday work and in statistics all over the web. Here are some examples of qualitative data in descriptions, research, work, and statistics.
Qualitative data in descriptions
Analysis of qualitative data requires descriptive context in order to support its theories and hypothesis. Here are some core examples of descriptive qualitative data:
The extremely short woman has curly hair and brilliant blue eyes.
A bright white light pierced the small dark space.
The plump fish jumped out of crystal-clear waters.
The fluffy brown dog jumped over the tall white fence.
A soft cloud floated by an otherwise bright blue sky.
Qualitative data in research
Qualitative data research methods allow analysts to use contextual information to create theories and models. These open- and closed-ended questions can be helpful to understand the reasoning behind motivations, frustrations, and actions—in any type of case.
Some examples of qualitative data collection in research:
What country do you work in?
What is your most recent job title?
How do you rank in the search engines?
How do you rate your purchase: good, bad, or exceptional?
Qualitative data at work
Professionals in various industries use qualitative observations in their work and research. Examples of this type of data in the workforce include:
A manager gives an employee constructive criticism on their skills. "Your efforts are solid and you understand the product knowledge well, just have patience."
A judge shares the verdict with the courtroom. "The man was found not guilty and is free to go."
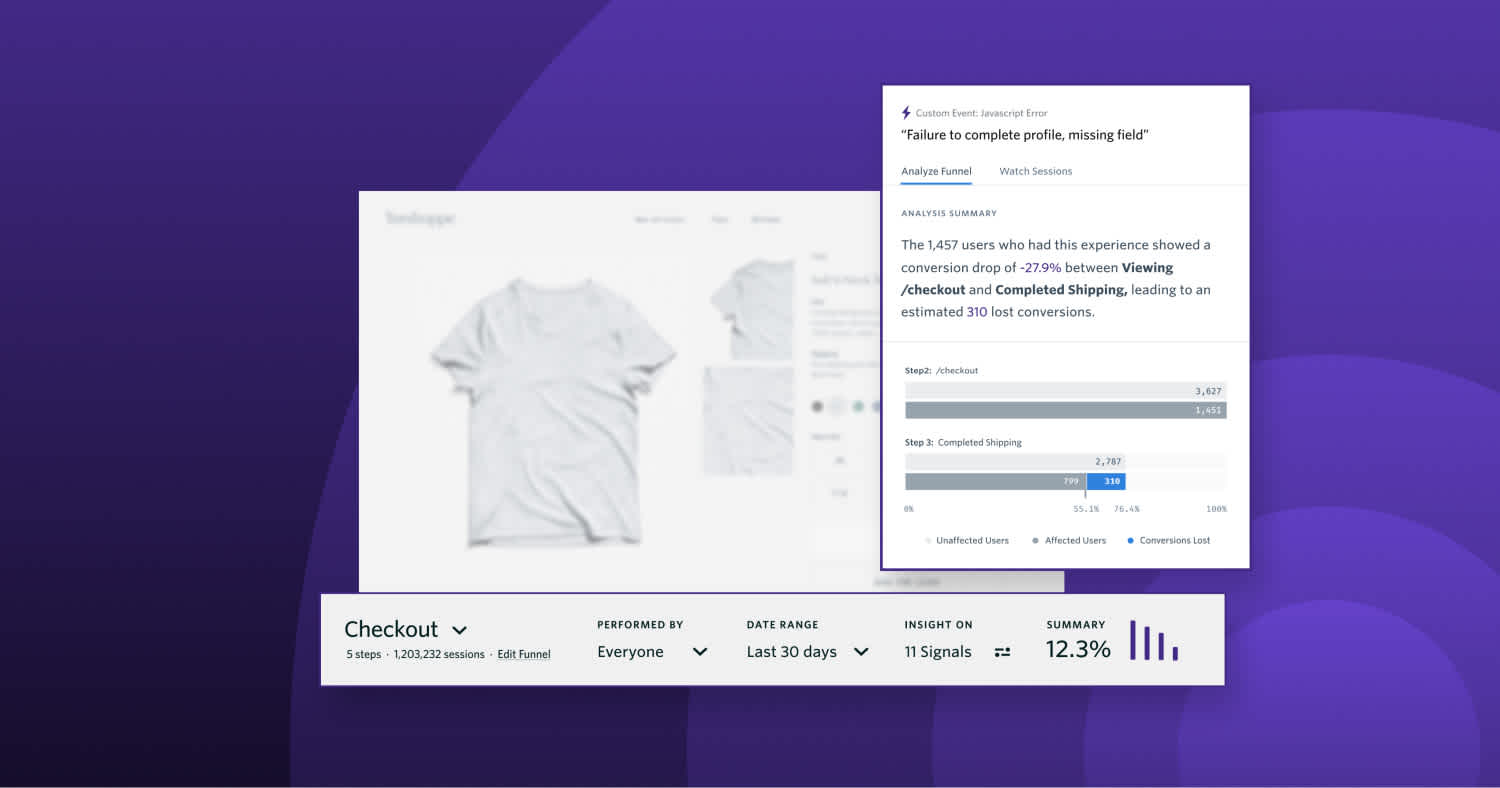
A sales associate collects feedback from customers. "The customer said the check-out button did not work.”
A teacher gives feedback to their student. "I gave you an A on this project because of your dedication and commitment to the cause."
A digital marketer watches a session replay to get an understand of how users use their platform.
Qualitative data in statistics
Qualitative data can provide important statistics about any industry, any group of users, and any products. Here are some examples of qualitative data set collections in statistics:
The age, weight, and height of a group of body types to determine clothing size charts.
The origin, gender, and location for a census reading.
The name, title, and profession of people attending a conference to aid in follow-up emails.
Difference between qualitative and quantitative data
Qualitative and quantitative data are much different, but bring equal value to any data analysis. When it comes to understanding data research, there are different analysis methods, collection types and uses.
Here are the differences between qualitative and quantitative data:
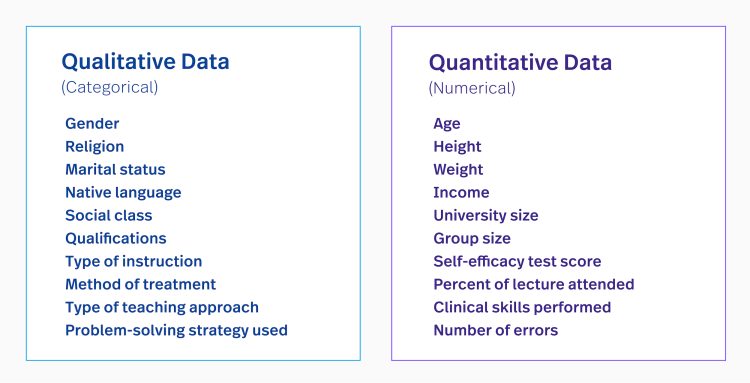
Qualitative data is individualized, descriptive, and relating to emotions.
Quantitative data is countable, measurable and relating to numbers.
Qualitative data helps us understand why, or how something occurred behind certain behaviors.
Quantitative data helps us understand how many, how much, or how often something occurred.
Qualitative data is subjective and personalized.
Quantitative data is fixed and ubiquitous.
Qualitative research methods are conducted through observations or in-depth interviews.
Quantitative research methods are conducted through surveys and factual measuring.
Qualitative data is analyzed by grouping the data into classifications and topics.
Quantitative data is analyzed using statistical analysis.
Both provide a ton of value for any data collection and are key to truly understanding trending use cases and patterns in behavior. Dig deeper into quantitative data examples.
Characteristics of qualitative data
The characteristics of qualitative data are vast. There are a few traits that stand out amongst other data that should be understood for successful data analysis.
Descriptive: describing or classifying in an objective and nonjudgmental way.
Detailed: to give an account in words with full particulars.
Open-ended: having no determined limit or boundary.
Non-numerical: not containing numbers.
Subjective: based on or influenced by personal feelings, tastes, or opinions.
With qualitative data samples, these traits can help you understand the meaning behind the equation—or for lack of a better term, what’s behind the results.
Types of qualitative data
As we narrow down the importance of qualitative data, you should understand that there are different data types. Data analysts often categorize qualitative data into three types:
1. Binary data
Binary data is numerically represented by a combination of zeros and ones. Binary data is the only category of data that can be directly understood and executed by a computer.
Data analysts use binary data to create statistical models that predict how often the study subject is likely to be positive or negative, up or down, right or wrong—based on a zero scale.
2. Nominal data
Nominal data, also referred to as “named, labeled data” or “nominal scaled data,” is any type of data used to label something without giving it a numerical value.
Data analysts use nominal data to determine statistically significant differences between sets of qualitative data.
For example, a multiple-choice test to profile participants’ skills in a study.
3. Ordinal data
Ordinal data is qualitative data categorized in a particular order or on a ranging scale. When researchers use ordinal data, the order of the qualitative information matters more than the difference between each category. Data analysts might use ordinal data when creating charts, while researchers might use it to classify groups, such as age, gender, or class.
For example, a Net Promoter Score (NPS) survey has results that are on a 0-10 satisfaction scale.
When should you use qualitative research?
One of the important things to learn about qualitative data is when to use it.
Qualitative data is used when you need to determine the particular trends of traits or characteristics or to form parameters for larger data sets to be observed. Qualitative data provides the means by which analysts can quantify the world around them.
You would use qualitative data to help answer questions like who your customers are, what issues or problems they’re facing, and where they need to focus their attention, so you can better solve those issues.
Qualitative data is widely used to understand language consumers speak—so apply it where necessary.
Pros and cons of qualitative data
Qualitative data is a detailed, deep understanding of a topic through observing and interviewing a sample of people. There are both benefits and drawbacks to this type of data.
Pros of qualitative data
Qualitative research is affordable and requires a small sample size.
Qualitative data provides a predictive element and provides specific insight into development.
Qualitative research focuses on the details of personal choice and uses these individual choices as workable data.
Qualitative research works to remove selection bias in data by using an open-ended response process.
Qualitative data research provides useful content in any thematic analysis.
Cons of qualitative data
Qualitative data can be time-consuming to collect and can be difficult to scale out to a larger population.
Qualitative research creates subjective information points.
Qualitative research can involve significant levels of repetition and is often difficult to replicate.
Qualitative research relies on the knowledge of the researchers.
Qualitative research does not offer statistical analysis, for that, you have to turn to quantitative data.
Qualitative data collection methods
Here are the main approaches and collection methods of qualitative studies and data:
1. Interviews
Personal interviews are one of the most commonly used deductive data collection methods for qualitative research, because of its personal approach.
The interview may be informal and unstructured and is often conversational in nature. The interviewer or the researcher collects data directly from the interviewee one-to-one. Mostly the open-ended questions are asked spontaneously, with the interviewer allowing the flow of the interview to dictate the questions and answers.
The point of the interview is to obtain how the interviewee feels about the subject.
2. Focus groups
Focus groups are held in a discussion-style setting with 6 to 10 people. The moderator is assigned to monitor and dictate the discussion based on focus questions.
Depending on the qualitative data that is needed, the members of the group may have something in common. For example, a researcher conducting a study on dog sled runners understands dogs, sleds, and snow and would have sufficient knowledge of the subject matter.
3. Data records
Data doesn’t start with your collection, it has most likely been obtained in the past.
Using already existing reliable data and similar sources of information as the data source is a surefire way to obtain qualitative research. Much like going to a library, you can review books and other reference material to collect relevant data that can be used in the research.
For example, if you were to study the trends of dictionaries, you would want to know the past history of every dictionary made, starting with the very first one.
4. Observation
Observation is a longstanding qualitative data collection method, where the researcher simply observes behaviors in a participant's natural setting. They keep a keen eye on the participants and take down transcript notes to find out innate responses and reactions without prompting.
Typically observation is an inductive approach, which is used when a researcher has very little or no idea of the research phenomenon.
Other documentation methods, such as video recordings, audio recordings, and photo imagery, may be used to obtain qualitative data.
Further reading: Site observations through heatmaps
5. Case studies
Case studies are an intensive analysis of an individual person or community with a stress on developmental factors in relation to the environment.
In this method, data is gathered by an in-depth analysis and is used to understand both simple and complex subjects. The goal of a case study is to see how using a product or service has positively impacted the subject, showcasing a solution to a problem or the like.
6. Longitudinal studies
A longitudinal study is where people who share a single characteristic are studied over a period of time.
This data collection method is performed on the same subject repeatedly over an extended period. It is an observational research method that goes on for a few years and, in some cases, decades. The goal is to find correlations of subjects with common traits.
For example, medical researchers conduct longitudinal studies to ascertain the effects of a drug or the symptoms related.
Qualitative data analysis tools
And, as with anything—you aren’t able to be successful without the right tools. Here are a few qualitative data analysis tools to have in your toolbox:
MAXQDA—A qualitative and mixed-method data analysis software
Fullstory—A behavioral data and analysis platform
ATLAS.ti—A powerful qualitative data tool that offers AI-based functions
Quirkos—Qualitative data analysis software for the simple learner
Dedoose—A project management and analysis tool for collaboration and teamwork
Taguette—A free, open-source, data analysis and organization platform
MonkeyLearn—AI-powered, qualitative text analysis, and visualization tool
Qualtrics—Experience management software


