Application startup time is one of the most important parts of building mobile applications. If an application is slow to start, users can get frustrated and switch apps without waiting for your application to actually load up. At Fullstory, we strive to help our customers create perfect digital experiences by surfacing and quantifying negative user interactions (like Dead Clicks, Rage Clicks, long loading times, etc.) and visualizing those experiences with Session Replay. When our customers integrate our SDK into their mobile applications, we want to automatically capture as much of those experiences as we can, with as little user impact as possible.
Recently, however, a customer prospect indicated that just by adding our SDK to their app, they saw a 6% increase in app startup time even when our SDK wasn't enabled, which seemed very suspicious. After the prospect shared a report from Emerge Tools, we were able to track down a quick win to reduce our SDK startup time on Android by 75%.
The problem
A prospect evaluating our SDK wrote to our team saying they noticed an increase to their application startup time when they added our SDK. Many times, these reports tend to be very fairly unscientific, so we end up asking our customers a lot of questions including:
What part of startup are they measuring?
What device are they using to measure?
What was the methodology?
How many times did they run the application? Was this after a fresh install, or warmed up in some way?
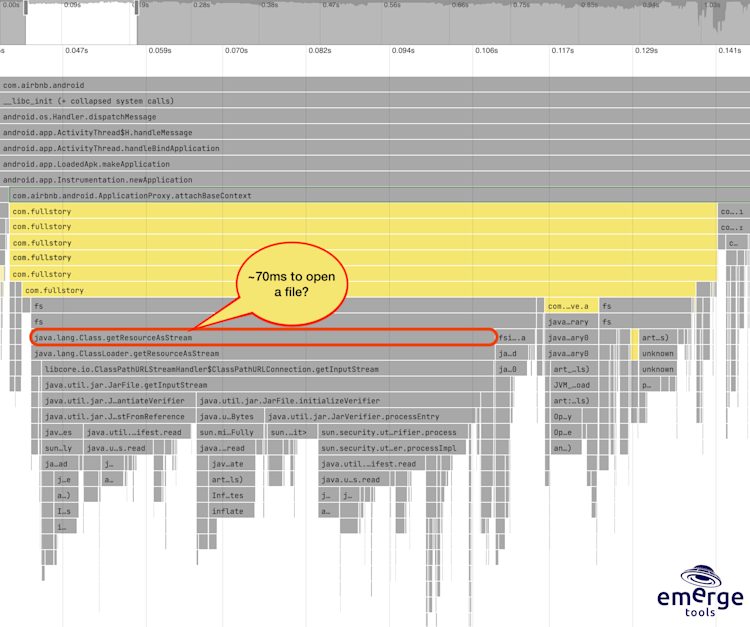
Without these details and a proper performance test environment, it's really hard to pinpoint a root cause for deteriorated performance, or what the impact is. In this case, we asked the prospect the above questions, and the prospect shared a screenshot of a report generated by Emerge Tools' Performance Analysis. The report pointed to some Fullstory methods impacting startup performance by around 6% within that customer's app, which translated to around 100ms in the test environment.
While this wasn't a huge number, it was surprising to us. Our SDK shouldn't impact startup time that much. Even turning our SDK off via our gradle plugin configuration options wouldn't have mitigated the impact, because we still need to run our SDK initialization when the application starts up.
What Emerge showed us
On app startup, we try to do as little work as possible until we can confirm a session has started.
We load our native code from our shared rust core.
We read the configuration file from our gradle plugin to see if
recordOnStartis not false.As long as Fullstory is configured to be on, we spin up a background task to make a request to Fullstory to grab privacy rules and make sure data capture is enabled.
This happens in ContextWrapper#attachBaseContext of the Application class. Looking closely at the Emerge Report the customer shared, the large block of time in this method was attributed to a call from our SDK into Class#getResourceAsStream.
NimbleBlog has a fantastic blog post diving deeper into the Android source code to explain why this method is slow, and I strongly recommend reading the whole post to get a deeper understanding of how the method works on Android. For our purposes, the method is a bit overkill given what we were using it for: reading a configuration file.
Initial solution - use Android assets
With an understanding of the problem (thanks to Emerge’s report), the solution seems pretty obvious - don't use ClassLoader#getResourceAsStream. With some creative thinking, I was able to move the configuration file into the Android assets directory. As mentioned in the NimbleBlog post, Android's Resource.get*(resId) system avoids the slowdowns that getResourceAsStream has, making it a much faster way to access assets.
Since we weren't customers of Emerge yet, we had to manually instrument measurements in our SDK to understand the impact of this change. The overall process is outlined below:
Add some measurements to our initialization method.
Write a script to start an application and kill it.
Run the test on a device repeatedly to gather enough data (80 samples on a Sony Xperia X compact running Android 8).
Collect the results in a Google Sheet.
We ran this process on our latest release branch–as well as on the branch with the initial solution–and compared the results of the mean measurements.
The initial impact: SDK initialization speed improved by 50% for our sample application.
The raw numbers improved from ~270ms to ~125ms, but raw numbers aren’t the greatest to rely on, as they can vary based on a lot of different factors including APK characteristics, device specs, OS version, cold vs warm starts, etc. Our sample application is purposely built to support testing a wide range of application scenarios, but it isn't as large of an APK as user-facing applications tend to be, so we could expect the impact on customer apps to be even more pronounced.
Armed with the data and a measurement suite–and never wanting to settle–I started wondering if there were any more improvements hiding in plain sight.
Bonus points: Defer, defer, defer
Looking more closely at the code and the data, I was still a little surprised at the time it took on some applications. One aspect about this config is that it contains two "categories" of configuration: configuration from the gradle plugin and metadata about the APK that we need when we have confirmed that we should capture data. But for customers who use our recordOnStart configuration to only start capture via an API call, we were still reading and parsing the dynamic metadata we'd only need when our SDK was actually capturing data. Depending on this application, the metadata could be fairly large, and I started to wonder - do we really need to parse all this information on startup?
With some refactoring, I managed to split the configuration categories into two separate files that could be read independently. We'd read the gradle configuration during startup that was much smaller, and once we’ve confirmed we should start capturing a session, we'll read the metadata, incurring the cost of parsing that metadata off the main thread.
To measure the impact of this change, we can reuse the framework above. However, it was important to recognize and measure that we were also adding time between when we confirmed a session and actually captured the first frame. To account for this, I added some measurements there to see the impact.
Results
Compared to our release branch, SDK initialization improved by 75% for our sample application from our release branch. The time added to read the metadata during session startup, however, increased by about 116%. But, this increase is observed off the main thread, which means it won't affect the end user's digital experience and makes the second approach a much more preferred solution.
As a sanity check, I wanted to make sure the time until the first scan wasn't impacted too much, and I found the two approaches were about the same. You can see the second approach is just a little slower than the first approach (presumably because we have to read/open the assets twice).
Summary
Without measuring the data, it's easy to miss how simple tasks like reading a configuration file can have a surprising impact on performance. Thanks to a customer sharing the data that Emerge collected, we were able to identify and fix a performance bottleneck we wouldn’t have looked closely at otherwise. We pride ourselves on helping our customers measure what matters, and Emerge helps us measure what matters to our SDK.


