In this blog post, we will introduce you to some key concepts relevant to scaling our analytics infrastructure at Fullstory, and review some of the things we did this year to meet the needs of our largest customers - both existing and future. We will also highlight a fortuitous event - the release and adoption of AMD EPYC™ processor based N2D instances - that ended up having an outsized impact on our most important workloads.
Keeping Up With Growth
Serving complex queries over 100s of TBs of data can be difficult to do cost effectively. Doing it with very low latencies, with data that is dynamic and constantly being mutated, can be hard to do at all. We have the fortunate position at Fullstory to remain a fast growing business in 2020. But with that fortune comes high expectations of our critical, state-maintaining infrastructure.
We have designed our systems at Fullstory (including our databases) to scale horizontally. And like most fast growing companies, we plan capacity in advance of when we need it. But back in April of this year, despite our planning, we began to see some unacceptable query performance for some of our larger customers. Their data sets, it seemed, had grown past some critical thresholds. We also had a sales pipeline filled with even larger customers, many landing imminently.
Time to continue to scale out, right? Well, as with any complex stateful system, there are caveats—in this case, query aggregation was becoming a bottleneck. Due to how our primary database manages data partitioning, it would require another power of 2 scaling in order to reduce long tail latencies for our larger customers. This meant doubling the cluster, which up until then was fine! But this time, we began seeing signals that our query aggregators were reaching their limits too, with memory constraints and nonlinear growth in CPU utilization.
What we had on our hands was a scaling bottleneck. But our business wasn’t going to stop growing! We had to fix this—and quickly. Running critical infrastructure like this can sometimes feel like being Scotty in the engine room of the Enterprise. Trying to double the output of the warp drives while the Romulans are attacking and all the consoles are sparking and on fire.
How fast is fast enough?
We are always working to improve performance and expand our capabilities at Fullstory. Faster queries over more data is always better. But how do we know if we are meeting the right bar? What should we be measuring and how should we be measuring it?
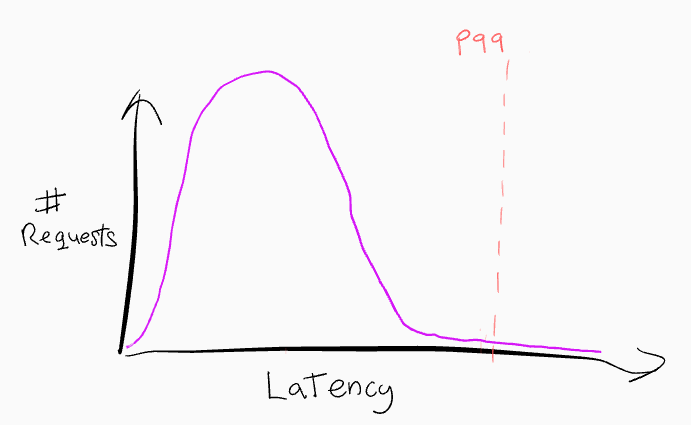
Engineers often speak in percentiles: p50, p75, p95, and p99 latencies for various service requests. The “long tail” of the distribution of latencies are often considered outliers. It’s very easy to write a high p99 off as being acceptable so long as the “common case” is fast. After all, by definition 99% of requests are faster than that, right?
Hiding in the long tail
The typical wisdom for UX responsiveness says that actions completing in under ~100ms are considered “instant”. At about 1s, users notice things being slow, but still retain continuity of focus. People get impatient after about 5s. Beyond 10s actions are no longer considered “interactive” and users will generally want to move on to doing something else.
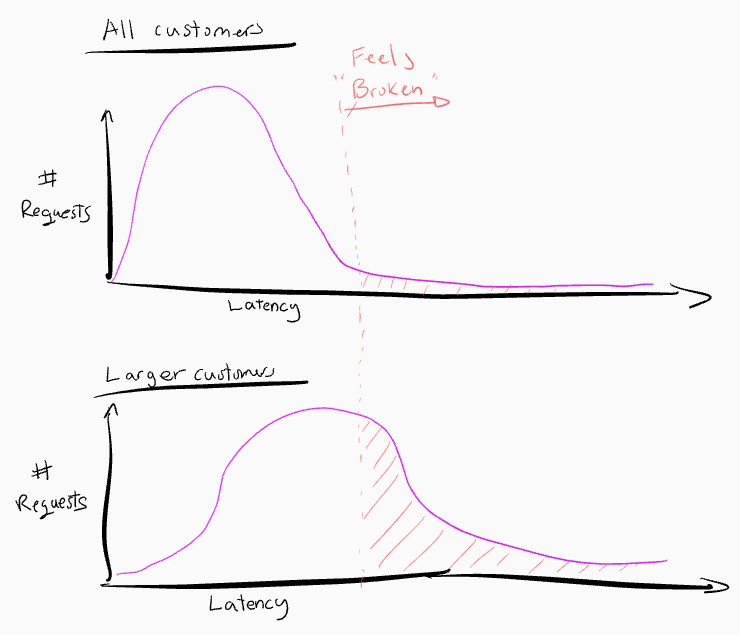
With p75 query latencies in a few hundred milliseconds, across many thousands of happy paying customers, you could say things are great! But this sort of analysis can be a bit too simplistic, and in Fullstory’s case, it doesn’t capture what we want to be measuring and optimizing for. The key observation is that the distribution isn’t uniform across all users’ experiences: we have a multi-tenant system, and every tenant has a slightly different performance curve. What we actually care about for our largest customers is hiding in the long tail.
Let’s take a look at this same distribution, but instead for a larger customer’s account.
Our long tail latencies weren’t merely outliers that could be ignored as transient issues. They were a significant portion of requests from our customers that had the largest data sets. These customers are the ones that should be getting the most value from Fullstory. And we were letting them down.
How do you make things faster?
Data makes scaling harder. And more data makes things... more harder. If you have a system designed to decouple compute from storage and elastically scale, then great! But as you scale your compute, you also need to copy data around in order to process it. That copying adds latency and cost. Conversely, you can speed things up by trading off elasticity and pre-provisioning the compute to keep it closer to the data. Lowering latencies by avoiding the need to copy data at all. There are also hybrid designs in between. It’s all tradeoffs. There is no free lunch. Pre-splitting and pre-provisioning compute is how our analytics database (Solr Cloud) manages to scale. This is ironically also the source of our query aggregation bottleneck.
Getting back to our problem at hand. We needed to make our queries faster for increasingly larger data sets - and do it quickly!
We already had a bunch of systems, architectural, and algorithmic improvements in flight. In no particular order, we had been evaluating or working on:
Addressing the query aggregation bottlenecks to unblock further doubling the downstream systems and data shards.
Getting rid of binary data partitioning entirely to not be limited to powers of 2 scaling.
Reducing load on the database entirely using clever caching at various tiers of the stack.
Hot spot and critical path analysis inside the database to spot-optimize.
Rolling out more query rendering and query planning optimizations.
Algorithmic changes inside the database itself to change the complexity of common query paths.
OS and VM (including JVM GC) tuning.
These kinds of solutions typically require full engineering development and deployment cycles. Many of them also involved substantial changes to large open source projects (like Solr Cloud). Which further extends the time to roll out since we (as best as we can) try to stay in sync with upstream development, and therefore aim to avoid getting stranded with large change sets that can’t be upstreamed easily.
Making things faster right now meant something more tactical. As mentioned earlier, horizontal scaling was off the table (see power of 2 scaling). But what about vertical scaling? Typically "vertical scaling" means "make the box bigger” for the process[s] running on it by adding more CPU cores to the box. While Lucene does support multithreaded segment searching, this is not yet exposed in Solr (or ElasticSearch for that matter). Because of that, we are limited to 1 thread per searcher querying a shard, and can only leverage those extra cores to lower latencies if we further subdivide our data. “Making the box bigger” (ie. adding more cores) is - for us at least - equivalent to horizontal scaling. To vertically scale we would actually need to make the actual CPU cores faster.
Conveniently, making the cores faster had just become an option on GCP: Enter N2D instances, based on 2nd Gen AMD EPYC processors. These instance types had recently come out of beta and were aggressively priced with nearly equivalent monthly pricing per vCPU (factoring in sustained use discounts) to N1. It was time for some testing!
Evaluating Options
We’ve invested heavily in open source software, contributing things we’ve built internally as well as funding the development of software projects we depend on. One of our investments is an open source load testing and benchmarking harness (https://github.com/fullstorydev/solr-bench) for Solr and Lucene. With this, we’ve been able to run repeatable indexing and query load tests to help us evaluate feature and infrastructure decisions.
Our benchmarking harness spins up a cluster of VMs, and measures the time to index a few million documents, and subsequently issues a standard battery of distributed queries of various complexities, also measuring the time to complete those. This harness performs JVM warming ahead of running the indexing and querying benchmarks to measure steady state performance. It then does many runs and generates a report summarizing the results.
In this case, smaller is better: we saw about ~17% improvement in p95 query latencies on this specific benchmark suite. Not bad, especially considering this cluster wasn’t any more expensive!
Note: Google also made new N2 instances based on Intel Cascade Lake (vs “up to” SkyLake based Xeons for N1 instances) Generally Available. But their monthly pricing was significantly less attractive than N2D (more than 15% more expensive than N2D). N2D (at least on paper) offered a cost neutral change from N1, with a potential 13% cost savings over N1 if we factor in 1 year committed use discounts.
Real World Results
Our benchmarking really amounted to synthetic laboratory testing. It’s hard to test a full production sized cluster with real production-equivalent workloads. We knew N2D would be better, but it wasn’t clear how much better.
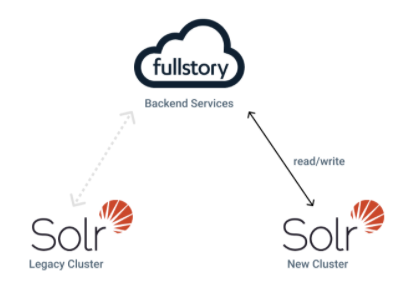
We have the ability to stand up mirror copies of our primary analytics database with the same contents and running the same indexing and query workloads. We do this via a blue/green cluster deployment approach, allowing us to run two mirrored databases at the same time.
If you are curious about how Fullstory performs database deployments and upgrades at scale. Then check out this blog post where my colleague, Clay, talks a bit about how we migrate 100s of TBs of data to new database clusters with zero downtime.
So now we had 2 clusters. The legacy N1 cluster and our new N2D cluster. Both handling the same read and write load. This gave us a very direct apples to apples comparison.
Fixing The Long Tail
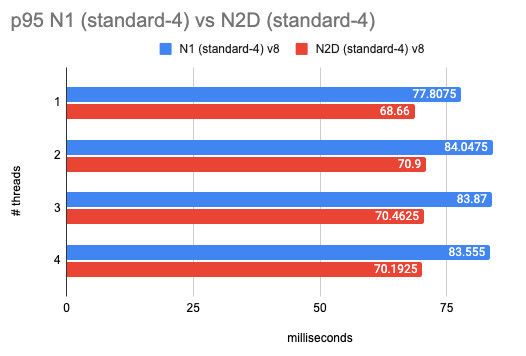
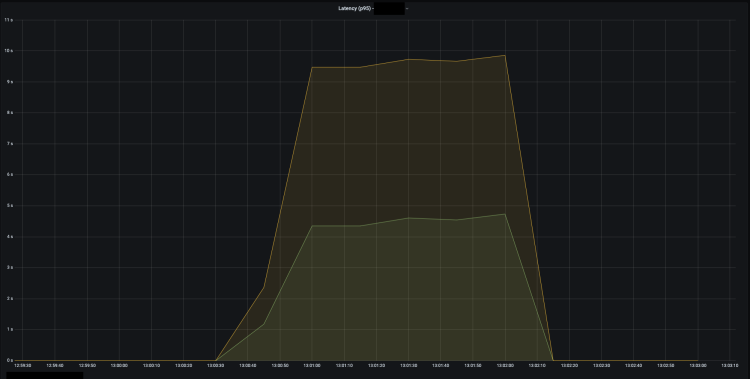
I’ll cut to the chase. Some of our p99 slowest queries (for which we had like-for-like latency measurements between old and new clusters) improved by ~40+%. Here is an example of a batch of slow queries for the same workload. N2D in green.
Sample p95 latency for a batch of N queries for the same workload. Distribution constrained to sample from "very large" customers. Sliding window aggregated.
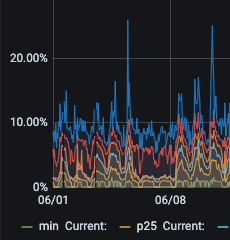
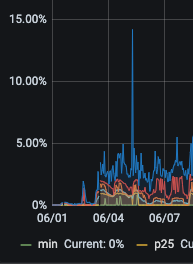
Why did we see better results in prod than in our isolated tests? Due to the heterogenous workload mix of indexing and ad-hoc queries, it’s hard to isolate a single mechanism but we have some hypotheses. For queries hitting hundreds of nodes in parallel, the long tail latencies will be subject to the slowest node. Distributed systems with hundreds of machines are really almost like organic systems. Sometimes you have second order effects. The slowest node can have its responses driven up by things like GC pause times. And it’s possible that in production, things like GC pauses (which we didn’t benchmark in our load test) have outsized impacts on long tail latencies. We saw time spent in GC across all percentiles get cut in half.
old cluster GC - all percentiles
new cluster GC - all percentiles
Cutting GC time in half also had some nice auxiliary benefits. We saw fewer Zookeeper disconnects that previously would happen when there was a very long pause. So on top of being faster and more responsive, overall cluster stability and availability was better.
TLDR
Switching to N2D instances on GCP for our primary analytics database cut p95,99 latencies for our largest customers by as much as ~40% in some instances. We ended up with lower latencies, better utilization, and a smaller bill. All of which bode well for cost-efficient future infrastructure growth. Needless to say we are actively investigating deploying N2D in other parts of our stack that are compute or memory bandwidth bottlenecked.
Moving to N2D had the added impact of buying us much needed runway to continue working on algorithmic and system architecture improvements. We’ll need these improvements to keep up with our growth since we (presumably) can’t bank on pulling a generational CPU upgrade rabbit out of our metaphorical hats every year 😅.
So in conclusion. If you’ve not modernized the hardware powering your cloud infrastructure in the last year or so, you should probably take a look at what’s out there. For us, the new N2D instances on GCP (running on 2nd Gen AMD EPYC processors ) have been totally game changing.
Appendix
If your data is sharded via binary partitions, then you might only see long tail latencies improve once you hit a power of 2 number of partitions. Adding 50% more compute (for a single threaded processing system) for example doesn’t actually let you finish your work faster (though you do have lower utilization of compute).
Versus the next power of 2 which cleanly fits all the work units and has half the overall processing time.
If you further subdivide your data, making them each half the size. You then need a subsequent doubling of the compute units to fit them to the number of compute units. Halving the overall processing time:

