In our previous discussions on conversion analysis and user friction, we highlighted how to identify the top frustration signals in applications and created a dashboard to monitor these signals. These methods typically review historical data, potentially days or weeks old. What if we could monitor issues more proactively, almost in real-time? This post outlines how to achieve that.
Building blocks for proactive monitoring
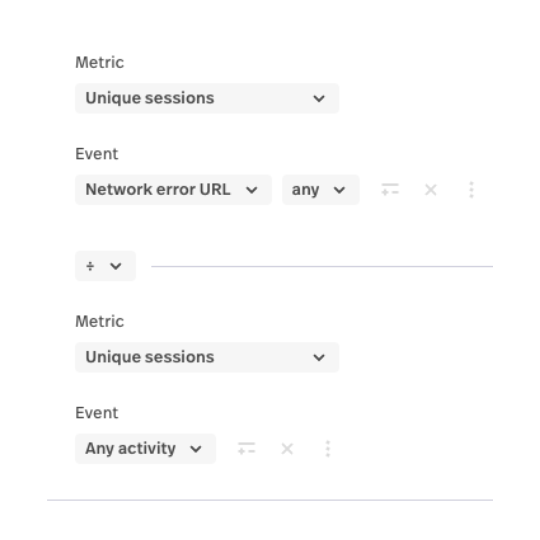
The foundation of our proactive monitoring approach is to track the percentage of sessions exhibiting a particular signal. For instance, we want to monitor the rate of sessions experiencing a network error. We would calculate this metric by dividing the number of sessions with a Network Error URL by the total number of active sessions.
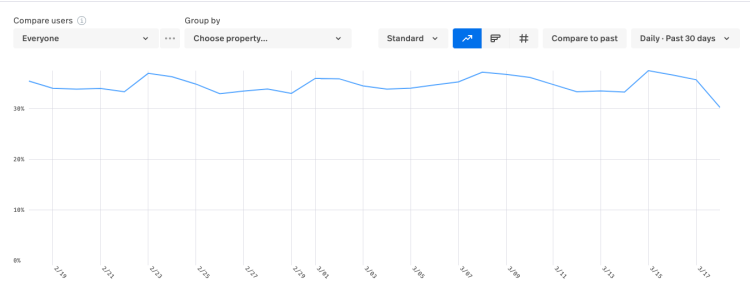
Typically, while an ideal metric value might be 0%, most systems maintain a "baseline" error percentage—our example uses a baseline between 33% and 37%. We can set an alert for any percentage above this baseline, say 38%, to indicate an issue worth investigating.
Setting up Metric Alerts
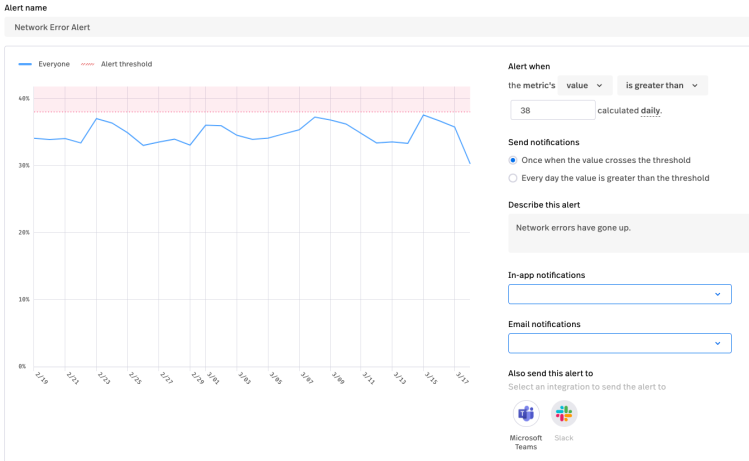
If a metric only has one segment and does NOT have a group by, you can set up a metric alert on it.
A metric alert can be set up in a number of different ways, but for this post, we are going to focus on setting a high water mark, in this case 38%. We will send the alert when the metric value is greater than 38%. You can send metric alerts in the app, via email, and also to Microsoft Teams or Slack.
This alerting mechanism is just to tell you that something is going on that you should investigate further. How do you use Fullstory to investigate further? You should use the dashboard we created in the previous post. It will allow you to dive into the particular signal by various dimensions, as well as see a trend over time. Often, if there is an acute issue, you will see a spike in the particular text or a new signal showing itself where a signal wasn’t before.
Implementing Metric Cards
We should set up a metric card and alert in this way (% of sessions that had the signal) for each of the seven signals in the previous post. When one of the alerts goes off, you can use the detailed dashboard to investigate the potential problem further.
This is especially true right after a new release. These metric alerts can be invaluable at detecting hidden bugs a new release causes. If you do a gradual rollout, you can track these signals in both the existing and new code to really zero in if the new release is to blame. Here are the seven signals from the previous post and what an increase in the signal on a given day might also mean:
Network Errors - A sudden increase in Network Errors across all of your calls and Pages often means an outage or performance degradation. A sudden increase in a single or small number of calls could mean a partial outage or a bug.
Dead Clicks, Rage Clicks, Thrashed Cursor, Refreshed URL - A sudden increase in these frustration signals, in the absence of a corresponding Network Error, usually means a bug has been introduced in the code or a code delivery problem has appeared.
Uncaught Exceptions, Console Errors - These signals are often paired with one of the stronger signals above. They can be useful in determining causes of bugs or outages. They are also very useful with newly released code, as a new Uncaught Exception or Console Error could signal an misuse of a new library.
Dashboard customization
Once you have a metric card for these seven signals, it is recommended that you create a dashboard with the metric cards for quick reference. While these seven signals work across all customers, there are most likely additional things you should be monitoring that are specific to your business.
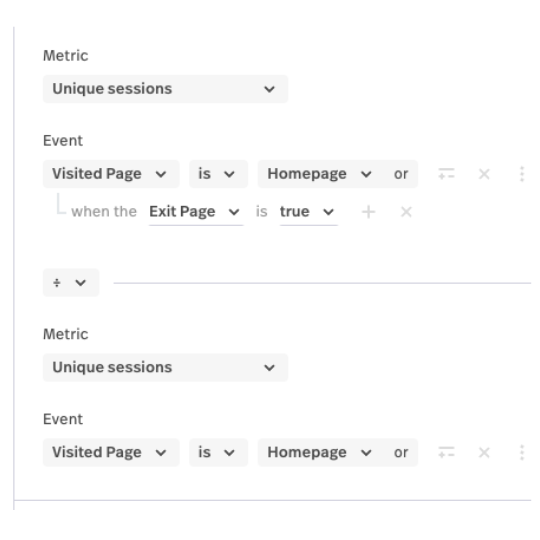
One key metric to monitor is the exit rate for your key pages. To build an Exit Rate with Fullstory, you divide the number of sessions where a given Page or URL is visited and the Exit Page by the number of visits to the Page or URL.
As with the % sessions having a signal described above, the exit rate of key pages often has a tight baseline.
You can set up a metric alert similar to the alerts described above representing the exit rate of your key pages such as view cart, checkout, login and home page. In addition, you could monitor things like conversion rate, bounce rate (entry and exit page are both true), and add to cart rate.
When one of these alerts goes off, you can then use the dashboard and techniques from the previous post to diagnose what is happening.
These dashboards we have described are a great template to use for specific groups within your organization. You can make a copy of the dashboards, and then use the dashboard filter area to filter for specific scenarios like a given brand, set of pages, or other segments you can create.
Fullstory can be a powerful tool for proactively monitoring key metrics of your application.


