This is Part I of a two-part series about how Fullstory’s Technical Program Management team created and operationalized a cloud cost management program.
Do any of these challenges sound familiar?
Understanding the cost impact of a new product feature or architectural change requires tedious one-off analysis.
Engineers have little or no visibility into cost data, making it difficult to think about cost as part of the design process.
Surprise spikes in cloud resource usage aren't discovered until the monthly invoice arrives.
These challenges are common in organizations where cloud cost data is siloed and only accessible to a small handful of employees. At Fullstory, we've found significant value in making this data transparently available to the entire product organization. In this post we’ll discuss our rationale for democratizing cloud cost data, how we implemented it, and some of the tangible benefits that we’ve seen thus far.
Creation of the Costs program
Standing up a Costs program was one of the first orders of business for our Technical Program Management team after the team was founded in early 2020. At the outset, we identified three outcomes that we wanted to achieve with the Costs program:
1. Cloud expenditures are well-understood and predictable.
Cloud costs have a tremendous impact on key financial metrics like gross margins and cost of goods sold, and directly influence our pricing and go-to-market strategies. Understanding and attributing every dollar of our cloud spend will become increasingly important as our company matures. Being able to predict our costs over a longer time horizon helps our Finance team plan more confidently, and also enables us to receive discounts from our cloud provider (Google) by committing to future usage.
2. Cost information is transparently available to product teams, allowing them to make informed tradeoff decisions.
Our goal here is not to make our product teams hyper-fixated on minimizing costs. Fullstory is in growth mode, and engineers should mostly be concerned with developing new features and scaling our infrastructure rather than shaving a few dollars off of our cloud bill. However, if done properly, we find there are numerous benefits to providing teams with visibility into the cost of the services they own. First, it enables engineers to discuss and reason about costs during the design process, leading to more scalable and sustainable architectural decisions. Second, an unexpected spike in costs often uncovers an operational issue or bug that needs to be corrected. And third, transparent cost data also helps surface low-hanging fruit: changes that don't require much engineering effort but result in massive needle-moving cost savings for the company. Overall, our viewpoint is that cost should be just one of many inputs that factor into a team’s decision-making and prioritization processes.
3. Costs are minimized without sacrificing engineering velocity.
This is a counterweight to the previous point. If we start to notice that we’re spending so much effort on minimizing costs that it’s actually slowing us down, then we need to re-evaluate our priorities. There is certainly a point of diminishing returns, beyond which it requires much greater effort to achieve smaller and smaller cost savings. Teams should always feel comfortable raising a red flag if they feel that we’re over-indexing on costs.
Technical implementation
In order to achieve our goal of democratized cost data, we needed a pipeline to transform raw Google Cloud billing data into actionable insights. We defined three major deliverables to address our use cases:
An easy-to-use SQL table that could be queried by humans or consumed by other tools,
Dashboards in our business intelligence tool (Looker) for those who prefer visual exploration of the data, and
Automated Slack alerts to notify us when a service experiences a cost spike.
Single Source of Truth
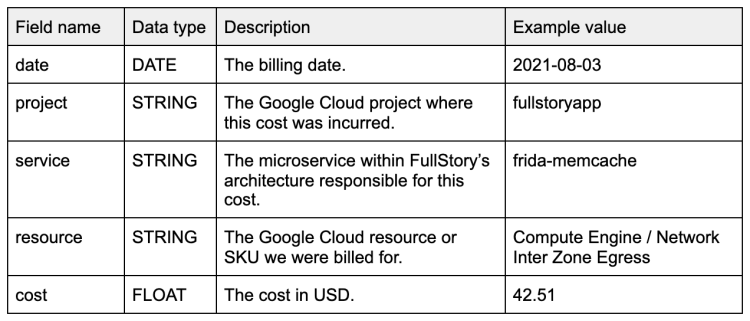
The first deliverable was a SQL table to display daily cost data in an approachable, easy-to-understand format. This would serve as our source of truth and would be a prerequisite for the later deliverables. Each row would represent the cost incurred by a particular microservice within Fullstory’s architecture for its usage of a specific Google Cloud resource. For example, one row could indicate the cost of Network Inter Zone Egress attributed to Fullstory’s `frida-memcache` service for a given day.
The desired schema for our SQL table.
To arrive at a table like this, we began with raw Google Cloud billing data. We used GCP’s main billing export and Kubernetes cluster resource usage export to pipe the raw data into Google BigQuery.
Transforming this raw data into a useful format was a major project unto itself (though fortunately, much of this had been completed prior to the TPM team's involvement). A SQL query was created to combine the main billing data with the Kubernetes cluster usage data, and the result was a simplified table grouped by date, service, and GCP resource. We made extensive use of labels in order to achieve service attribution, and we configured our infrastructure so that service labels were automatically applied to Google Compute Engine and Kubernetes Engine instances.
Finally, in order to get this on rails, we needed to turn our existing query into a more permanent table. We opted to use a BigQuery view (essentially a virtual table). Once set up, the view could be leveraged in a variety of ways: it could be queried directly by human users, consumed by other tools, or integrated into Connected Sheets.
Data exploration and visualization
Having our cost data in BigQuery was great for our SQL-savvy users, but we also wanted the data to be accessible to FullStorians without SQL experience (or who simply preferred to interact with the data in a visual way). Looker is our business intelligence tool which sits atop our BigQuery data warehouse, and it is perfectly suited for this use case.
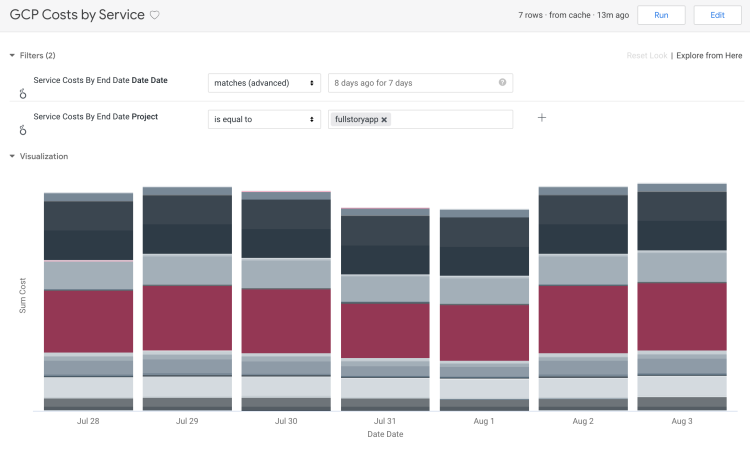
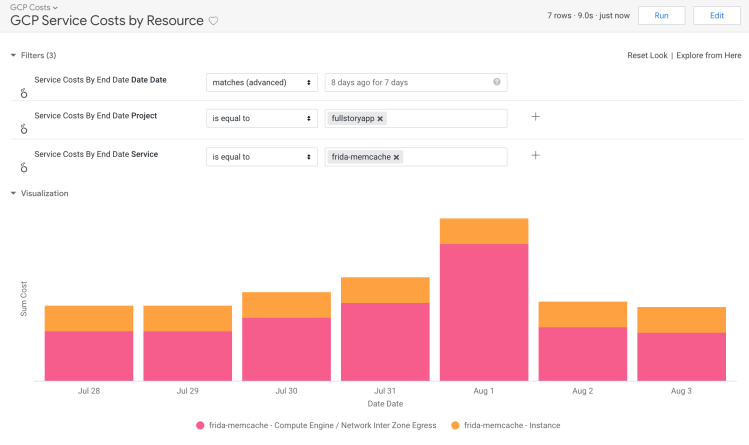
To surface the cost data within the Looker UI, we first created a View that referenced the underlying BigQuery fields. Then we added an Explore so that any of our Looker users could drill into the data. Finally, we made several Looks (pre-built visualizations) to give users a starting point for answering common cost-related questions. The two main Looks we created were:
GCP Costs by Service. For a given GCP project, this Look lets us visualize costs grouped by the various services within Fullstory’s architecture. This gives us a macro perspective of which services are the main drivers of our cloud costs.
GCP Service Costs by Resource. For a given service, this Look lets us further examine the cost broken down by the specific GCP resources used by that service. This includes Google Compute Engine and Kubernetes Engine (CPU, memory, and disk), networking, and various hosted services such as Google Cloud Storage and Datastore.
Bonus! To quickly navigate to this Look for a particular service, we can combine Google Chrome’s custom search engine functionality with Looker’s ability to override filters via URL parameters.
This enables us to enter a service name and go directly to the Look with the desired service pre-populated in the filters.
Proactive alerting
At this point we had truly made our cost data accessible to anyone in the organization who desired it- no SQL experience required. This was a great achievement! However, in order to stay on top of the cost of their services, product teams would still need to remember to manually run a query or check Looker from time to time. To use Fullstory parlance, this was not a very bionic solution. This brings us to the pièce de résistance of our cost data pipeline: automated cost spike alerting. The ultimate goal here was to receive Slack messages when a service experienced a substantial cost spike on a day-over-day, week-over-week, or month-over-month basis.
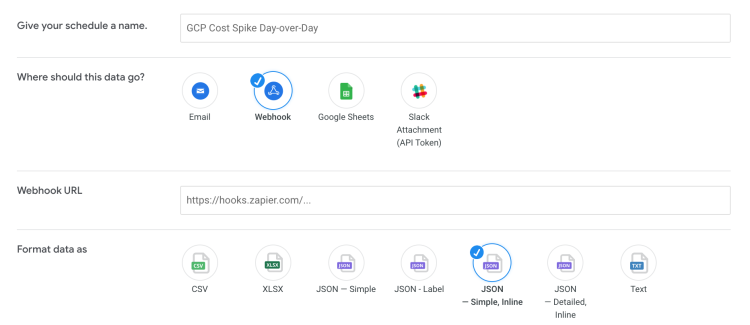
To implement this, we first created a Look in Looker for each of our desired alerts (e.g. “GCP Cost Spike Day-over-Day”). Each Look was formatted as a table displaying the service name, the cost value for the most recent day, the cost value for the previous day, the percent change, and a boolean field to indicate whether an alert-worthy spike had occurred. The boolean field was based on both the absolute value of the cost as well as the percent change; in other words, a 50% increase for a service that costs $2 is probably not worthy of an alert, but a 50% increase for a $2,000 service certainly would be.
Once each Look was in place, we set up scheduled webhooks to run each Look on the appropriate cadence and send the results in JSON format to a Zapier webhook URL.
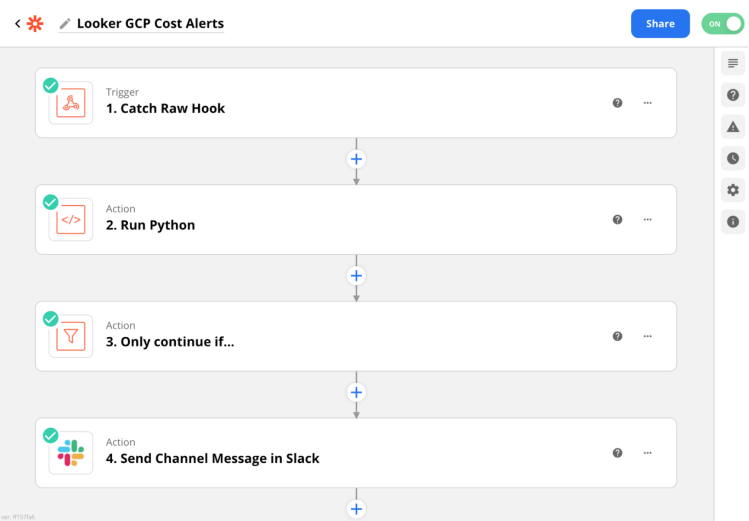
On the Zapier side, we created a Zap to catch the webhook payloads from Looker. The Zap executes some Python code to parse the relevant values from the JSON payload. Then, if there is a nonzero number of alerts to send, the Zap will format the Slack messages and post them to the relevant channel.
Finally, we can see our cost alerts in Slack! The message includes all the necessary context, as well as a link that navigates directly to that service’s cost visualization in Looker for further investigation.
Our Technical Program Management team will triage these alerts as they arrive and collaborate with the service owners as necessary. We also regularly tune our alerting thresholds to ensure that these messages are always relevant and actionable in order to avoid alert fatigue.
Results
In the ~18 months since standing up the Costs program and democratizing our cloud cost data, we’ve seen numerous tangible benefits across the product organization. In particular:
Modeling the cost of a proposed architectural or product change has become immensely easier. Previously this process would involve ad-hoc analysis with data cobbled together from various sources. Now, using the BigQuery view as our single source of truth, we can connect to Google Sheets and create models using real, live data. For example, using the BigQuery data, we recently created a “functional cost model” to better understand how each area of the Fullstory platform (data ingestion, processing, storage, search, etc) contributes to our unit economics. This model has been instrumental in helping us confidently make major product strategy decisions.
Slack-based cost alerts regularly surface unexpected spikes that would have otherwise gone unnoticed. Not only has this led to substantial monetary savings, but we’ve also identified misbehaving services and fixed bugs prior to them being noticed by customers.
Cost mindfulness has become ingrained in our engineering culture without slowing us down. Now that we have a common dataset and vocabulary to talk about cost, engineers are more likely to discuss cost earlier in the software development lifecycle. Engineers have also started proactively coming to the Technical Program Management team to talk through the cost implications of their designs. And even if we miss something in the design phase, we can rest assured that our Slack alerting will quickly catch any unforeseen spikes and notify us accordingly.
Overall, we’ve found that making cost data easily accessible has been a huge net-positive for our product organization. By explicitly communicating our intentions and goals throughout this initiative, we were able to achieve the positive effects without sacrificing engineering velocity or culture. Stay tuned for Part II of this series to learn about how we’ve operationalized our cost data and used it as the foundation for more sophisticated systems and processes.
The series continues in part II: Increasing cost awareness by modeling cost-saving projects

