User experiences are complex. You certainly don’t need us to tell you that. You also don’t need us to tell you that sometimes users don’t take the paths you predicted or behave in the ways you thought they would.
Actions that felt perfectly intuitive during the UX design process can turn out to be confusing or frustrating for users. Sometimes, this can result in dead clicks—clicks on elements of a page that aren’t actually meant to be clicked on, and therefore don’t do anything.
For example, one Fullstory customer thought it would be helpful to display credit card logos on their checkout page as a visual representation of the accepted payment methods. But they eventually came to realize that their would-be customers thought the logos were buttons, and were futilely clicking the logos in an attempt to choose their payment method.
The company found that this confusing experience was leading to tons of dead clicks on one of their most important web pages—not an ideal customer experience.
A behavioral data platform can help you unearth dead clicks and other critical UX issues on your site or product.
Keep reading for a deeper explanation of dead clicks and how DXI shows you where they’re hiding.

What are dead clicks?
Dead clicks are clicks that have no effect on the page or the element that is being clicked on. They could be clicks on a page’s blank space, or clicks on an element that a user thinks is a button but actually isn’t.
Similar to other friction signals inside of Fullstory like rage clicks, error clicks, or thrashed cursors, dead clicks are a negative metric that signals some sort of poor or unexpected user experience. Monitoring and measuring these clicks can help you understand if there are confusing elements on your web page that could be causing frustration for your users.
Why do dead clicks happen?
Some common causes of dead clicks are:
An image looks like it should zoom in when you click it, but doesn’t
Users expecting a text string to be a link
A button that isn’t connected to an action or simply isn’t working properly
In instances like these, if a click occurs and nothing on the page changes within a few seconds of a click, it’s considered a dead click.
No matter the cause, it’s important to find dead clicks and make adjustments, whether that’s fixing a broken button or changing a page’s layout.
How do you find dead clicks?
The easiest way to identify and analyze dead clicks is with Digital Experience Intelligence.
Sophisticated Digital Experience Intelligence (DXI) platforms are built to surface problematic events so teams can quickly understand their root cause and resolve it. DXI tools also clearly show how often issues happen and on which pages, so teams can measure the impact of any problem you uncover.
Using a Digital Experience Intelligence platform like Fullstory, you can also use Session Replay to watch what your users are doing before and after a dead click. This detailed context combines qualitative and quantitative data to reveal exactly what’s causing your user confusion.
By filtering your users and sessions based on dead clicks, you can see all the factors impacting your conversions, like slow pages, script errors, frustrating workflows, and device-specific bugs.
How do you measure dead clicks?
Turn to your DXI platform to unearth sessions that contain dead clicks. Like any search in Fullstory, the Dead Click attribute can be combined with other search criteria to narrow your search as needed.
For example, perhaps you’ve noticed a spike in form abandonment on one page. By analyzing that page in Fullstory, you might uncover that the button to submit the form isn’t working as it should, resulting in dead clicks and lost conversions.
To best understand the impact that dead clicks might be having on your site or app, here are a few questions you might ask:
What are the most dead-clicked elements on my site or app?
What percentage of our users dead-clicked on each of the misleading or broken elements?
Do those percentages differ for users on mobile devices?
Do different segments of users dead click the same elements?
Which parts of our onboarding UI have the most dead clicks among new users, and how is that delaying their time-to-value?
How often do they occur on our checkout page? How might that be affecting conversions?
You can apply these questions to other frustration signals like Rage Clicks and Error Clicks as well.
Important questions to ask about your dead clicks
What are the top dead clicked elements on your page?
What percentage of users dead clicked on each of them?
Do those percentages differ for users on mobile devices?
How many dead clicks happened on our most critical pages?
Do paying customers tend to dead click more with the same features as non-paying customers?
What parts of our onboarding UI have the most dead clicks among new users?
Which buttons on our checkout page tend to have dead click errors most often?
By answering these questions, you can begin to build the key metrics used to measure dead clicks (and more). You can also apply these questions to other Fullstory frustration signals like Rage Clicks and Error Clicks, or Thrashed Cursors.
How to measure Dead Clicks in Fullstory
Using Fullstory, you can measure dead clicks in a few different ways.

You’ll find Page Insights helps you figure out what elements users are clicking the most, how far down the page users are scrolling, and the ability to quickly inspect elements to use in search.
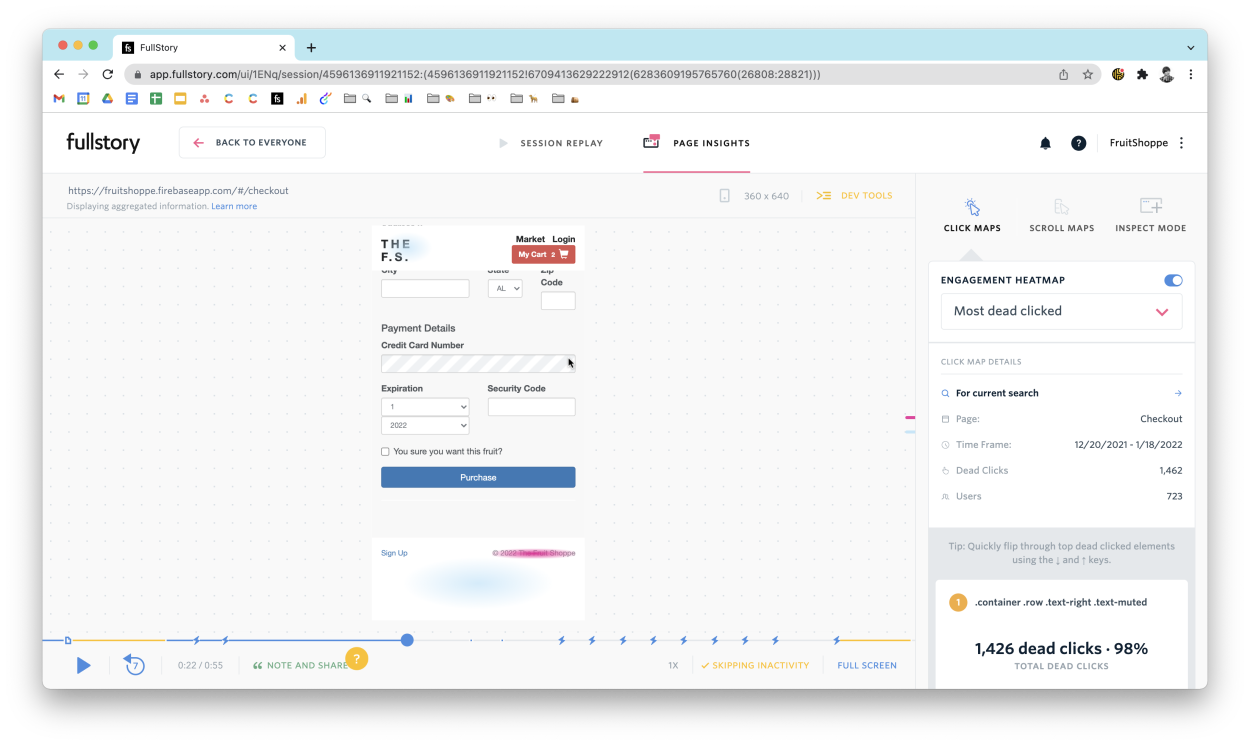
Page Insights provides a visual overlay of aggregate page statistics in sessions and lets you easily launch a search for sessions with similar dead click behavior.
When you’re watching a session, you can instantly view engagement data for any moment that in that session. As soon as you toggle to Page Insights mode, Fullstory will pause playback and show you an Engagement Heatmap for the current page you’re viewing.
Here’s what you’ll find:
Click Maps are a form of a heatmap that shows you where users clicked on your page.
Engagement Heatmaps show you a visual representation of the most clicked elements on the page. The Playback window will show you interaction data for that element.
Most Clicked Elements will show the aggregate of all clicks.
Scroll Maps show you a visual representation of max scroll depth for page views in the segment you are viewing.
Inspect Mode shows stats for any element you're interested in, to instantly drill down to a segment of users who have clicked that selector.
Discover where users dead click on your website or app
Even one dead click can be the difference between a conversion and a lost customer. Discover where users are finding errors.

