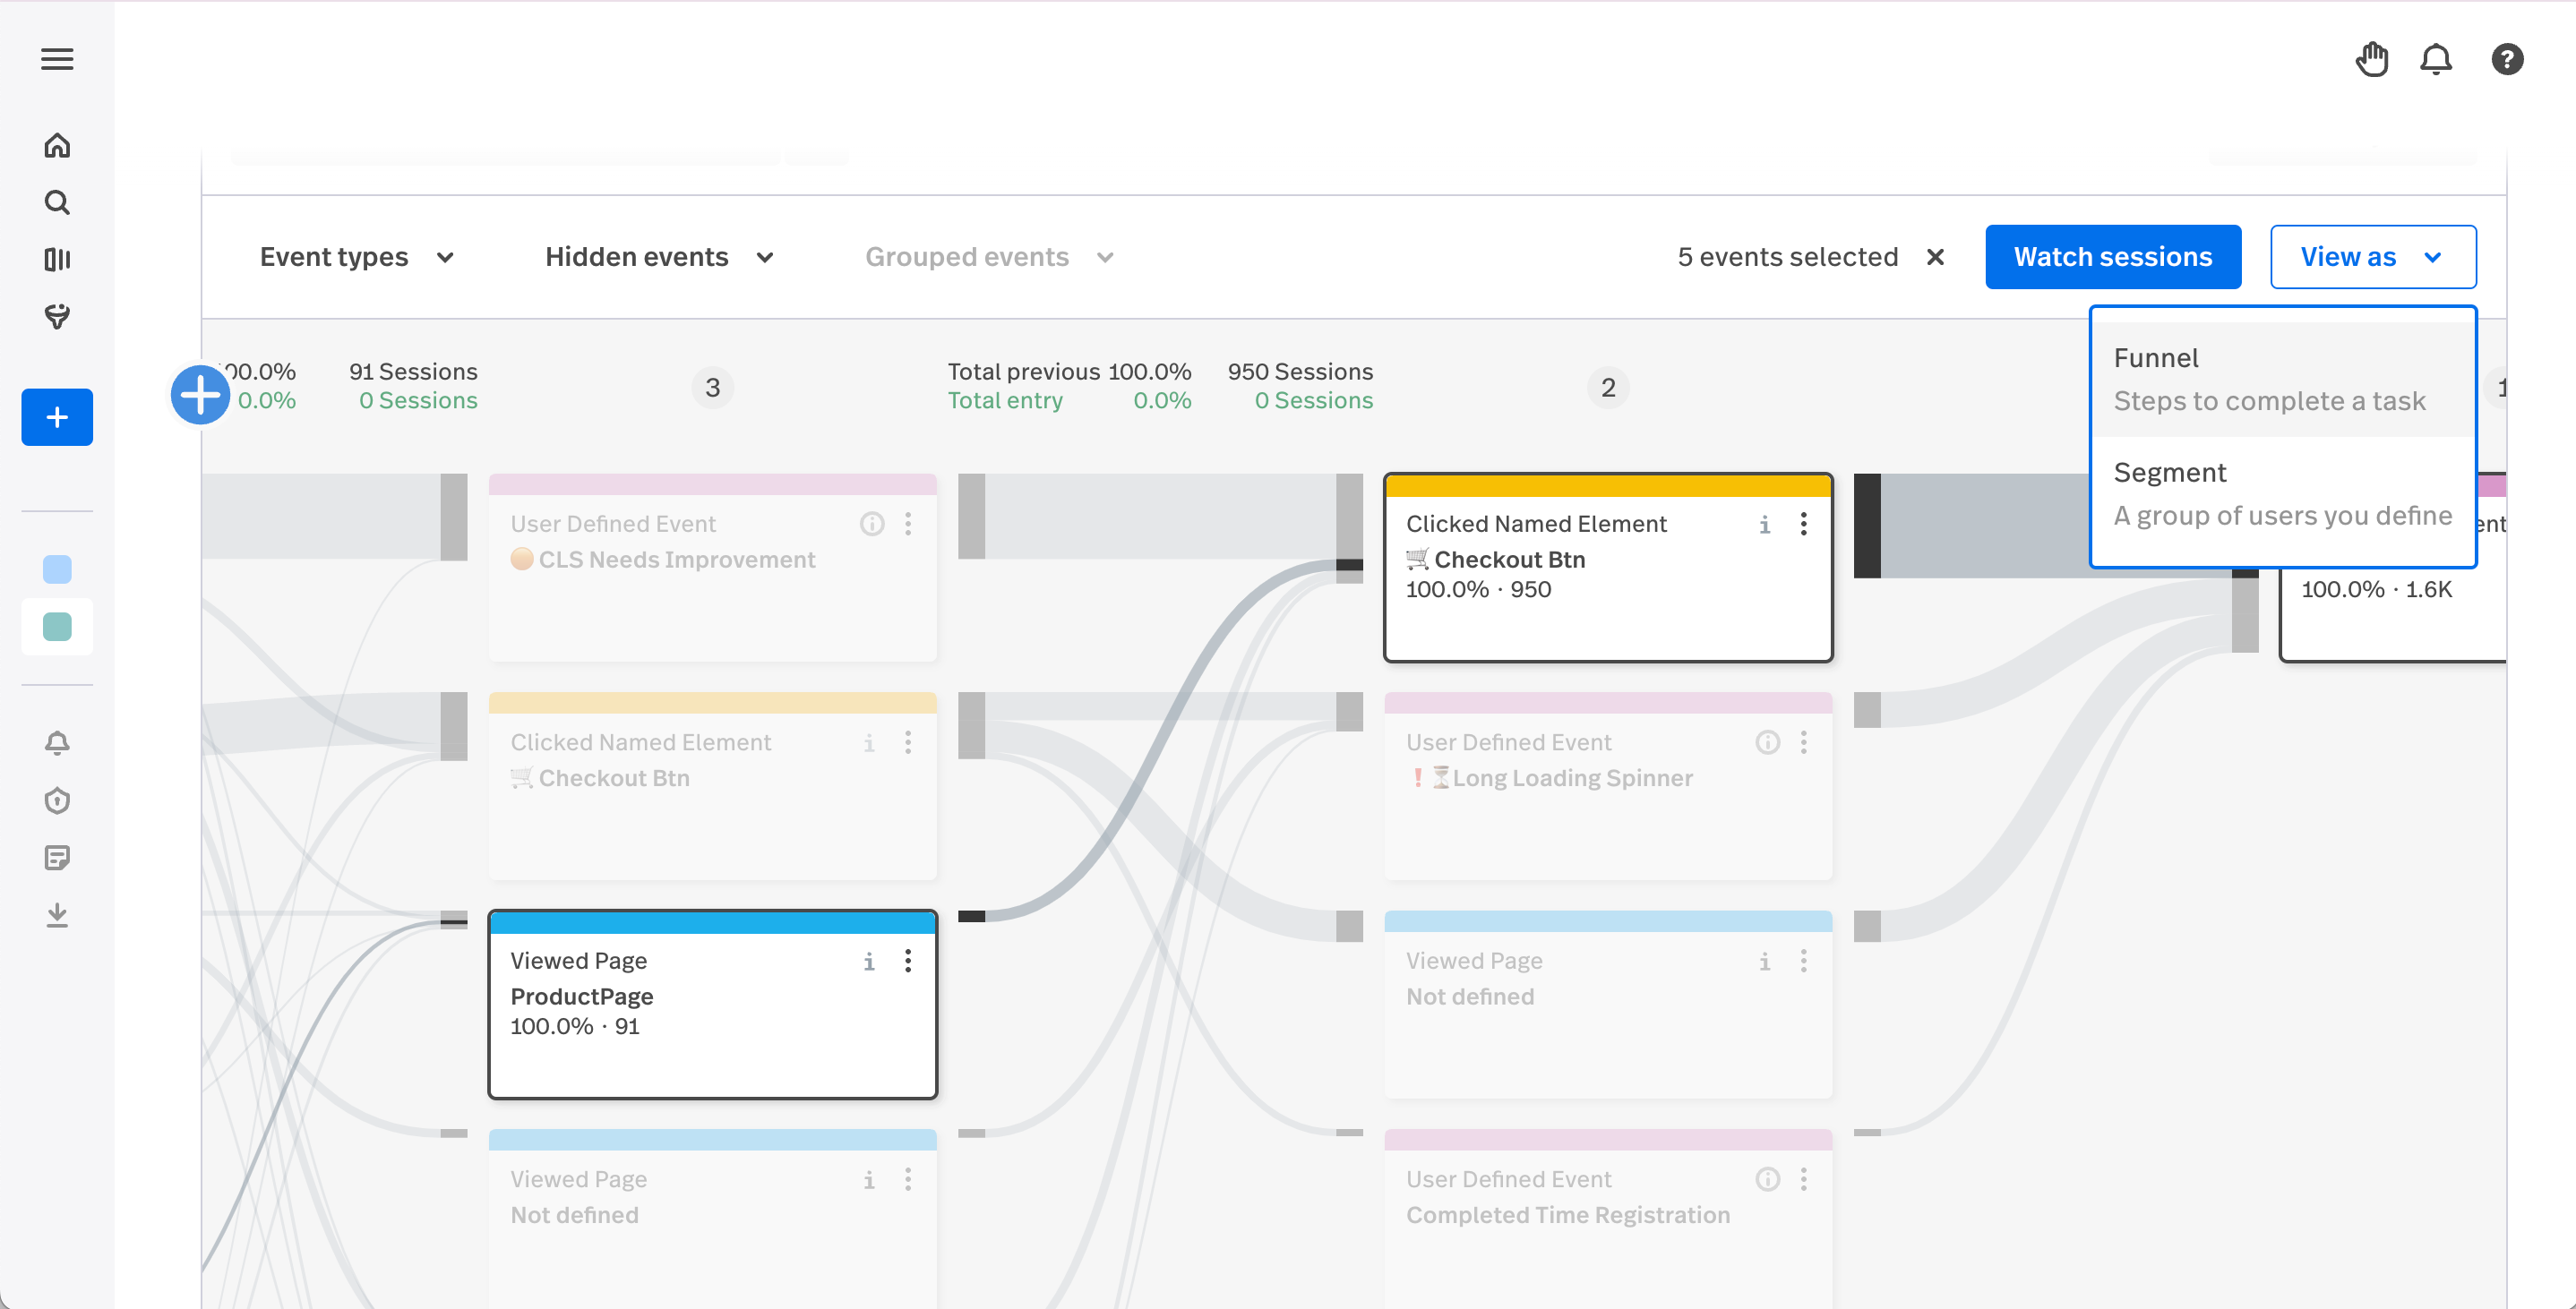
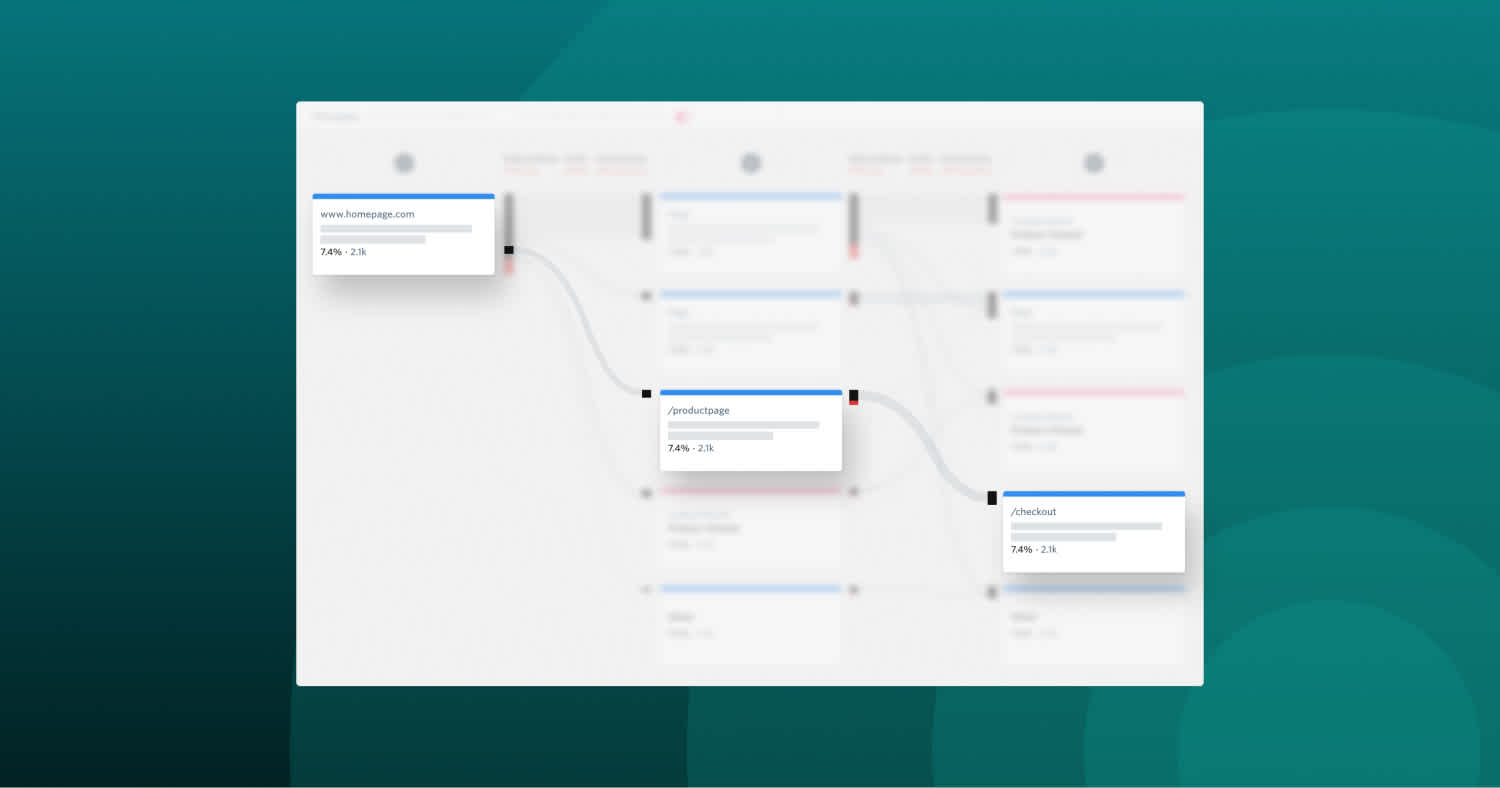
Traditional analytics might show you the endpoints. But that's not enough when you need to understand the entire customer path – and more importantly, where that path breaks down.
Why journey analytics matters now
45% of organizations are investing in customer journey analytics. According to McKinsey, companies using journey analytics see:
15-20% reduction in service costs
10-15% increase in revenue
Faster resolution of customer issues
The reality of fragmented customer experiences
Customer expectations are clear: 76% want consistent interactions across departments. The problem? Teams work in silos. Support doesn't see what sales knows. Marketing misses crucial product usage signals. 54% of customers report that teams don't share information.
This disconnect costs more than just customer satisfaction. It leads to repeated customer information requests, inconsistent service responses, and missed opportunities for personalization. Each touchpoint in isolation tells only part of the story.
So, what is customer journey analytics?
Customer journey analytics is a data-driven approach that tracks, analyzes, and visualizes how customers interact with your business across all touchpoints and channels over time. It transforms raw behavioral data into actionable insights about customer behavior and preferences.
Let's break that down. Your customers might:
Start with a Google search
Browse your pricing page
Check out your competitor
Come back two days later
Finally convert
Journey analytics reveals these paths. More importantly, it shows you which paths lead to success, and which ones don't.
The building blocks of journey analytics
Every click. Every page view. Every support ticket. These are your touchpoints – the basic units of customer behavior. But they're just the start.
What really matters is how these touchpoints connect. It's about understanding:
What actions typically lead to conversion
Where customers get stuck
Which features keep them coming back
When and why they reach out for help
The tools have evolved too. Today's analytics stack uses machine learning to spot patterns humans might miss, helping you predict behavior instead of just reacting to it. Modern platforms can process millions of interactions in real-time, turning raw data into insights you can actually use.
No more guessing about what your customers want. No more wondering why they leave. Just clear data showing exactly how they move through their journey with your product.

What can customer journey analytics do?
Digital interactions have exploded. Customer paths aren't linear, and traditional metrics miss crucial context. Journey analytics fills these gaps.
Predict churn before it happens
Watch how customers engage with your product. Spot the early warning signs when valuable accounts start to drift away. See which features keep users coming back.
Turn confusion into conversion
Find the exact moment users get stuck. Learn why they hesitate at checkout. Understand what makes power users so successful - then help everyone else follow their path.
Make smarter product decisions
For SaaS teams, see which onboarding flows actually drive activation. Ecommerce companies can pinpoint what browsing patterns lead to bigger purchases. Fintech providers can spot where users need extra guidance during complex transactions.
This isn't about collecting more data. It's about understanding what your customers are really trying to tell you.
Journey maps vs analytics: Understanding the difference
Many teams have journey maps. Few have journey analytics. Here's why you need both:
Journey maps show the "what"
Visual flow of ideal customer paths
Hypothetical customer stages
Planned touchpoints and goals
Journey analytics reveal the truth
Actual paths customers take
Where reality differs from plans
Quantifiable impact of each touchpoint
For example: Your journey map might show a clean path from signup to activation. But analytics might reveal users taking unexpected detours through help docs or getting stuck on specific features.
Get the best of both
Combine them to:
Validate or disprove journey assumptions
Find paths you never mapped
Measure the impact of journey improvements
The most successful teams use maps to plan and then analytics to verify and adjust based on real user behavior.
How to build effective journey analytics
Most journey analytics projects fail, not because of bad tools or data but because teams overcomplicate the process. Here's a straightforward path to getting it right.
Step 1: Automate your data capture
Stop relying on manual tracking. Modern journey analytics needs automatic capture across all channels, giving you retroactive insights from day one. Tools with autocapture capabilities ensure you never miss valuable interaction data that could reveal why customers succeed—or struggle.
Fullstory's Fullcapture, for example, automatically collects every user interaction without manual instrumentation, ensuring complete data coverage from the start.
Step 2: Connect your data sources
Break down platform silos. Your customer data lives in multiple places:
CRM records
Support tickets
Product usage logs
Marketing analytics
When these connect, you get the full story of how customers move through your product.
Step 3: Map journeys that matter
Forget complex flowcharts. Focus on critical customer journeys that impact revenue:
User onboarding flows
Conversion sequences
Support interaction patterns
Upgrade decisions
Watch real sessions to understand why users take certain paths. This combination of quantitative and qualitative data reveals opportunities you'd otherwise miss.
Step 4: Create action workflows
Think about this - 67% of customers expect resolution within 3 hours. Set up:
Real-time alerts for friction points
Cross-team sharing of insights
Clear ownership of improvements
Regular testing cycles
Step 5: Test and optimize
Start with one critical journey. Make improvements based on data, not assumptions. Measure the impact on:
Customer satisfaction scores
Support ticket volume
Conversion rates
Revenue metrics
When you prove value in one area, expand your analysis to other important journeys.
Tools for journey analytics
Fullstory: Complete behavioral data
Automatic capture of every user interaction without instrumentation. Built-in customer journey mapping tools show exactly how users navigate your product.
Notable features of Fullstory include:
Retroactive data analysis
Session replay for context
AI-powered pattern detection
Real-time alerts on friction points
Google Analytics: Basic traffic insights
Standard web analytics focused on page views and basic user flows. Provides:
Traffic source tracking
Basic conversion reporting
Limited user behavior data
No session replay capability
HubSpot: Marketing-focused mapping
Marketing automation platform with basic journey visualization. Offers:
Lead tracking
Email journey mapping
Form analytics
Limited behavioral data
The difference? Fullstory captures every single interaction automatically, while other tools require manual setup and miss crucial behavioral data. This complete picture helps teams spot opportunities they'd otherwise miss.
Here's how one company put these principles into practice.
Real impact: How Wahi doubled conversions with journey analytics
Despite tracking events through Amplitude, Wahi couldn't pinpoint why users abandoned key journeys. Form fills, chat interactions – users were dropping off, but the raw data couldn't explain why.
Finding answers with journey analytics
By implementing Fullstory, Wahi uncovered the true story behind their user behavior:
Identified specific friction points in forms and chat
Watched real user sessions to understand abandonment
Made rapid improvements based on actual user behavior
The results
100% increase in conversion rate year-over-year
Under 48-hour median time to bug resolution
Clear visibility into user pain points
The lesson: Event tracking alone isn't enough. Understanding the complete user journey – including the "why" behind user actions – makes the difference between guessing and knowing what to fix.
Read Wahi's full story here ->
Common journey analytics challenges (and how to fix them)
Data accuracy problem
The problem: Teams rely on manually-tagged events, missing crucial interactions and creating blind spots in customer understanding.
Solution:
Implement automatic data capture
Use server-side tracking for reliability
Validate through session replay
Data silos
The problem: As we briefly mentioned earlier, customer data lives in disconnected tools or silos. Support can't see product usage, product teams miss support context, marketing lacks behavioral data.
Solution:
Start with one critical flow (like onboarding)
Connect tools affecting that flow
Build automated data pipelines
Team alignment
The problem: Insights stay trapped in analytics tools. Different teams work from different data sets, leading to conflicting priorities.
Solution:
Share session replays for clear context
Create unified customer views
Set clear ownership for improvements
While these challenges are common, they're not insurmountable.
Ready to see your customer journey clearly?
Your customers are trying to tell you something. Their clicks, their hesitations, their successes and struggles – it's all valuable data waiting to be uncovered. Fullstory's complete journey analytics platform helps you capture every interaction and make improvements that matter. See how your customers really experience your product – get started with a demo.


