As the digital world continues to expand, so does the need for top-notch analytics products. With the power of cutting-edge analytics, businesses can transform complex data into insightful information, delivering enhanced understanding, and resulting in more strategic and effective decision-making.
Below, we dig into the leading analytics platforms to provide an in-depth look into analytics products' dynamic world.
What are analytics products?
Analytics products are software tools or platforms that help businesses extract, process, and interpret data to generate actionable insights. They bridge the gap between raw data and decision-making, equipping businesses with the necessary tools to assess performance, track trends, understand customer behavior, and drive growth.
There are different types of analytics products, each offering a specific set of capabilities. The most common examples include:
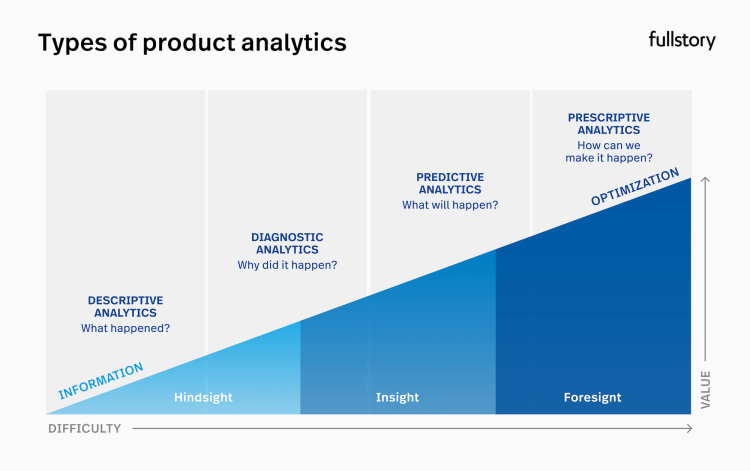
Descriptive Analytics: These tools analyze historical data to understand what happened in the past. They deliver insights through reports and dashboards, providing a clear view of business performance over a specific period.
Predictive Analytics: Powered by machine learning algorithms, these tools use historical data to make future predictions. They help businesses forecast trends, anticipate customer behavior, and make proactive decisions.
Prescriptive Analytics: These are advanced tools that not only predict the future but also suggest actions to take for optimal results. They leverage artificial intelligence and machine learning to automate decision-making processes.
Real-time Analytics: These tools process data as it comes in, providing instant insights. They're essential for businesses that require immediate responses, such as those in the ecommerce or finance sectors.
Why use analytics products?
The modern business environment is data-driven, with vast amounts of data being generated every minute. Product analytics have become vital tools to make sense of this data, turning it into actionable insights that guide strategic decision-making and foster business growth. Here are some of the biggest reasons to leverage one or more analytics platforms for your website or app.
Data-driven decision-making
Gone are the days when decisions based on assumptions or gut feelings were enough. Analytics tools provide businesses with solid evidence backed by data, greatly improving the accuracy and effectiveness of their decisions. Real-time analytics are crucial in this process, allowing businesses to quickly respond to market trends and changes in customer behavior. This immediate response not only enhances operational efficiency but also strengthens a business's competitive position in the market.
Improved customer experience
In today's customer-centric world, customer experience is crucial for business success. Analytics tools uncover valuable insights by identifying patterns and trends in customer behavior. Armed with this knowledge, businesses can tailor their products, services, and marketing strategies to better meet customer needs. This personalized approach increases customer satisfaction, loyalty, and ultimately leads to higher revenue.
Efficiency and productivity
Productivity analytics tools streamline processes by uncovering trends and patterns that guide smarter resource allocation. This not only boosts efficiency but also drives cost savings and profitability.
With real-time capabilities, teams can identify and resolve issues quickly, keeping operations on track.
The top product analytics platforms also include collaboration features, ensuring teams can act on insights together and improve workflow performance.
Risk management
In the ever-changing business world, risks and challenges are a normal part of daily operations. Predictive analytics tools help businesses identify potential risks and challenges in advance, enabling them to develop strategies to mitigate these risks.
Competitive advantage
Analytics tools provide valuable insights about the market, competitors, and customer behavior. Leveraging these insights can give businesses a competitive edge, helping them identify opportunities, devise effective strategies, and make informed decisions that differentiate them from competitors. Additionally, predictive analytics enables businesses to anticipate future trends, putting them at the forefront of their industry.
Innovation
Data insights from analytics tools can spark innovation in products, services, and business models. By identifying unmet customer needs and emerging market trends, analytics can inspire businesses to differentiate themselves and innovate. This drives business growth and establishes a reputation as an industry leader known for innovation.
Ultimately, this attracts new customers and increases customer retention.
Who should use analytics products?
Analytics products cater to a broad range of industries and professions due to their versatility, and professionals in nearly any industry can reap significant benefits
Business owners and executives: Analytics tools provide a comprehensive overview of business performance, empowering decision-makers with real-time insights that drive strategic planning and growth initiatives.
Product managers: Product managers can use analytics to track usage, understand feature adoption, and gain insights into customer preferences, thereby improving product development and customer satisfaction.
Marketers: With analytics, marketers can measure campaign effectiveness, understand customer behavior, and tailor strategies for optimal engagement and conversion.
Data analysts and scientists: These professionals rely heavily on data analytics tools for data mining, predictive modeling, and creating data visualizations to inform business strategies.
Customer service teams: Analytics can reveal patterns in customer inquiries and feedback, helping service teams enhance customer experience and resolve issues more effectively.
IT professionals: IT teams can use analytics to monitor system performance, identify potential issues, and ensure optimal operation.
Best analytics products for product analysis
Product analysis is crucial for understanding customer behavior, improving product features, and driving growth. Various analytics tools specialize in this and provide detailed insights.
Fullstory
Fullstory is a powerful digital experience intelligence platform known for its impressive capabilities in product analysis. It offers comprehensive insights into user interactions on your website or app, helping you understand how your product is used and where improvements are needed.
Fullstory offers session replay, funnel analytics, and click maps. The platform provides a robust array of features for capturing and analyzing digital experience data in real time. It leverages AI and machine learning for advanced predictive analytics and data mining, offering a full story about user behavior.
Pros of Fullstory
Real-time analytics provide instant insights
AI-driven analytics deliver predictive insights
Exceptional data visualizations make it easy to understand big data
Cons of Fullstory
There's a learning curve for some of its advanced features
Plans
Fullstory offers a free plan with limited features and other tiers with expanded functionality. Their Enterprise plan offers full access to the platform's capabilities, including advanced analytics, unlimited data retention, and priority support. Pricing is custom and based on specific needs.
Google Analytics 4
Google Analytics 4, the latest iteration of the popular Google Analytics platform, offers valuable insights into user behavior, helping businesses optimize their products. Google Analytics 4 provides real-time data, tracking features, and metrics. It offers both web and app analytics.
Pros of Google Analytics 4
Free for basic use
Integration with other Google products enhances functionality
Cons of Google Analytics 4
Can be complex for beginners to navigate
Limited customer support
Plans
Google Analytics 4 is free for basic use. An advanced version, Google Analytics 360, is available for enterprises with custom pricing.
Heap
Heap is an analytics platform that helps businesses approach product analysis. This includes tracking clicks, form submissions, transactions, emails, and more. With Heap, businesses receive a view of the customer journey, facilitating decision-making. Its reporting further helps businesses stay abreast with the latest trends.
Pros of Heap
Real-time reporting offers up-to-date insights
Cons of Heap
Implementation can be technically challenging and time-consuming
The user interface may be overwhelming for non-technical users
Plans
Heap offers custom pricing based on data volume and number of users.
Best for Business Intelligence
Business intelligence is critical for driving strategic decisions based on data. Several analytics tools offer strong business intelligence features. This section will compare Microsoft Excel, Domo, and Microsoft Power BI, giving you three powerful options for your BI management.
Microsoft Excel
Microsoft Excel, a component of the Microsoft Office suite, has long served as a trusted tool in statistical analysis and business intelligence. Owing to its extensive use across industries and professions, it brings a level of familiarity and ease of use that few other tools can match. Excel's primary strength lies in its powerful spreadsheet functionality. However, its capabilities extend far beyond this, offering a wide array of statistical and financial functions, pivot tables, and data visualization capabilities.
Pros of Microsoft Excel
Widely used and familiar to many.
Customizable for various data analysis needs.
Cons of Microsoft Excel
Lacks real-time data capabilities.
Can become complex and unwieldy with large datasets.
Plans
Excel is part of the Microsoft Office Suite, available in both standalone purchases and Microsoft 365 subscriptions, starting at $7/month for personal, and $10/month for family.
Domo
Domo is a cloud-based platform designed to provide direct, simplified, and real-time access to business data for decision-makers at all levels. Domo pulls together data from diverse sources, facilitating a unified view of business operations. It features interactive dashboards for a visual overview, and its data visualization tools translate complex data into comprehensible visuals.
Pros of Domo
Integrates with a wide array of data sources
Strong mobile access capabilities
Cons of Domo
The platform can be difficult for non-technical users
Customization requires technical expertise
Plans
Domo provides custom pricing based on business needs.
Microsoft Power BI
Microsoft Power BI is a collection of software services, apps, and connectors that transform unrelated data sources into coherent, visually immersive insights. Power BI can bring all your data together and turn it into coherent, visually immersive, and interactive insights. It offers data preparation, data discovery, and interactive dashboards.
Pros of Microsoft Power BI
Seamless integration with other Microsoft products.
Offers a good range of data visualization options.
Cons of Microsoft Power BI
Can be complex for non-technical users.
Limited ability to manipulate data compared to other tools.
Plans
Power BI offers a free version with limited capabilities, as well as more powerful paid versions. Power BI Pro is available for $10 per user/month, and Power BI Premium provides more capacity and flexibility starting from $4,995/month.
Tableau
Tableau is a leading tool in the field of business intelligence and data visualization. Designed for businesses of all sizes, Tableau provides an intuitive platform that transforms raw data into easily understandable formats.
It offers an extensive array of interactive data visualization, dashboarding, and data blending capabilities, thereby turning complex data into insightful narratives. With Tableau, users can drill down into their data, conduct in-depth analyses, and generate reports that aid strategic decision-making.
Pros of Tableau
Intuitive data visualization and dashboarding tools
Good data handling capacity
Cons of Tableau
Can become expensive for large teams
It has a steep learning curve for advanced features
Plans
Tableau offers a range of plans, starting with Tableau Viewer at just $15/month, and including Tableau Explorer for $42/month and Tableau Creator for $70/month.
Best for Data Exploration
Data exploration is a preliminary step in data analysis, where businesses deploy a range of techniques from statistical summarization to visualization methods to understand the makeup of a dataset. It's a critical process that uncovers patterns, identifies anomalies, and confirms assumptions with data.
Several tools offer these capabilities, but their efficacy varies significantly.
Looker
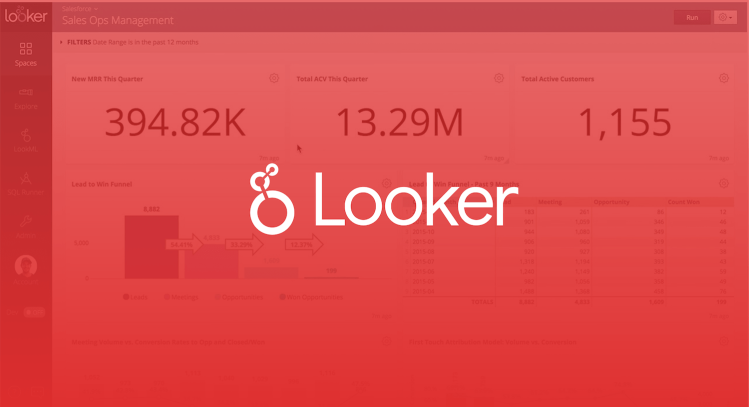
Looker is a modern data platform that is part of Google Cloud and offers powerful data exploration and business intelligence capabilities. Looker provides a platform for data exploration, visualization, and operational analytics. It offers advanced features like customizable dashboards, scheduled data deliveries, and data collaboration.
Pros of Looker
Highly customizable for various data needs
Seamless integration with SQL databases
Cons of Looker
Requires technical expertise for effective use
Customization can be time-consuming
Plans
Individual Viewer Users can be had for $30/month, the Standard User level is $60/month, and the Developer User is $125/month.
